Polling: BIPOC Voter Attitudes Toward Voting Methods
Public Wise partnered with Change Research to poll BIPOC voters in Arizona, Georgia, North Carolina and Pennsylvania.
Change Research surveyed 4,814 likely voters from August 12 – 19, 2020 to yield a representative sample in Arizona, Georgia, North Carolina, and Pennsylvania. The margin of error is ± 1.3 for the full sample and larger among subgroups.
Key Findings
- There is a five-fold growth in voters’ plans to vote-by-mail or absentee ballot in the traditionally lower vote-by-mail states of Georgia, North Carolina, and Pennsylvania, from 4% historically to 20% who intend to vote-by-mail in 2020.
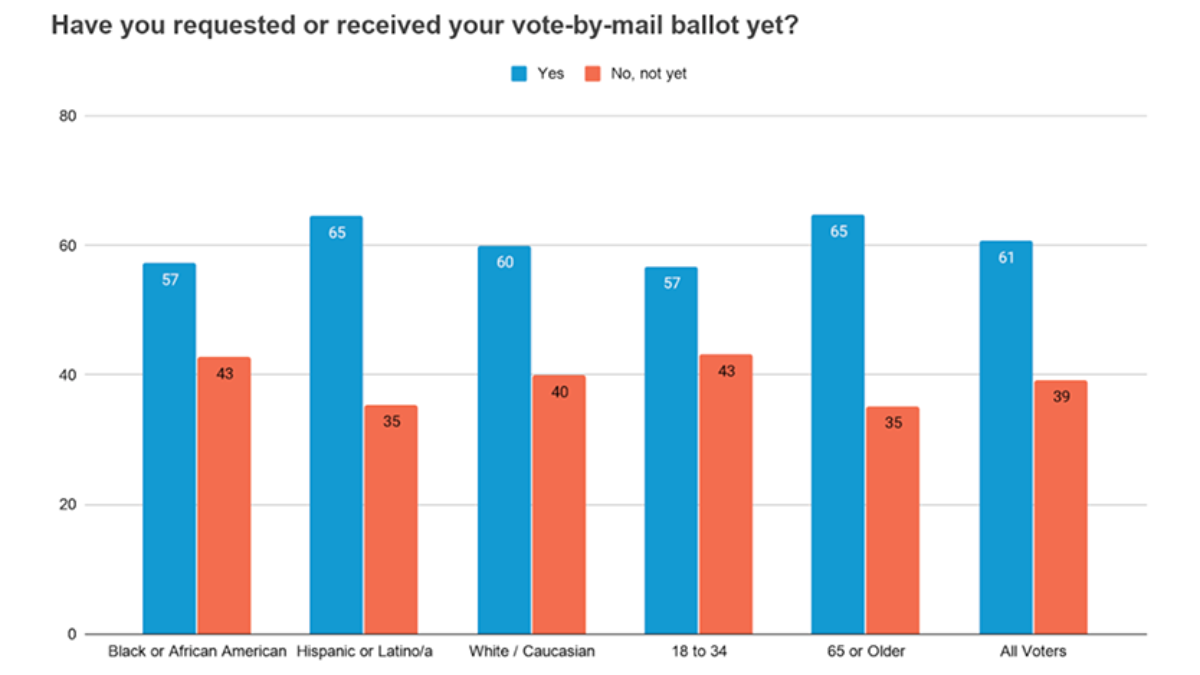
- However, 39% have not requested or received vote-by-mail ballots and 25% feel that they know nothing or little about their voting options for 2020.
- The data demonstrate that there are significant opportunities to create campaigns on the security and ease of both vote-by-mail and in-person early voting, especially among Democratic, Independent, and African American voters:
- Early in-person voting has a history in Georgia and North Carolina among Democratic and African American voters. The messaging on convenience addresses these voters’ concerns on mail-in voting and coronavirus concerns around in-person Election Day voting.
- Pennsylvania has no history of early in-person voting, but a sharp growth in mail-in voting interest among Democrats, from 6% historically to 48% in 2020. Mail-in voting is the best option to address voter concerns among Democrats.
- Voters in Arizona have a strong history of mail-in voting with only a 4% shift towards in-person voting. Promoting mail-in voting with messaging related to its convenience remains the best option here.
- Voters across demographics report being extraordinarily motivated to vote this year in comparison to previous years. 96% are an 8 out of 10 in terms of their motivation or higher. Voters are likely to be receptive to messaging that helps them engage that motivation and intention.
Voting Choices and Vote-by-Mail
42% of voters overall believe that contracting the coronavirus is a very serious or serious concern with in-person voting. The concern increases to 60% among Hispanic voters, 67% among African Americans, and 78% among Democrats. Long lines are also a concern among 50% to 60% of voters in these three groups. However, getting time off from work and transportation to the polling sites are a material concern to only 4% to 8% of voters.
There are concerns about mail-in-voting as well. While it is not a surprise that 70% of Republicans are concerned about the safety and security of vote-by-mail, 58% of Independents, 37% of African Americans, and 24% of Democrats also share this concern.
In the historically low mail-in or absentee voting states of Georgia, North Carolina, and Pennsylvania, there is a five-fold jump from 4% of voters usually voting by mail or absentee to 20% who intend to vote that way in 2020. This shift is from in-person on Election Day to vote-by-mail with in-person early voting at similar levels. Arizona has a strong history of mail-in-voting and there is no material change.
For voters who intend to vote-by-mail, 39% have not requested or received their mail-in ballot.
In Georgia and North Carolina, early in-person voting has been the usual method of voting for 26% to 33% of voters, rising to 32% to 43% among African Americans and 31% to 50% among Democrats.
- Arizona has always been a high mail-in-voting state and voters show only a 4% shift from mail-in voting to in-person Election Day or in-person early voting.
- Georgia and North Carolina have a strong history of early in-person voting, especially among African Americans and Democrats. Even though there is an increase in the desire to vote-by-mail, a more successful approach may be to continue to emphasize the early in-person voting that voters are comfortable with.
- Pennsylvania has little history of mail-in voting and none for early in-person voting. Mail-in voting has been made easier in 2020. Considering the increased interest in Pennsylvania in mail-in voting from 6% to 48% among Democrats, and from 1% to 24% among African Americans, awareness and promotion of mail-in voting is the best option.
About 25% of the voters overall, and 25% of persons of color, know little or nothing about the options that they have for voting this year and how they work.
State Specific Voting Plans
Arizona
- All voters: 49% by mail, 35% in person EDay, 11% early voting
- As is generally true elsewhere in 2020, Democrats lean 73% towards voting by mail vs. 9% in person EDay
- Republicans lean 57% in person EDay and 29% by mail
- Independents: 40% by mail and 45% in person EDay
- Voters 65 or older prefer mail in voting over in person Eday 60% to 26%.
Georgia
- All voters: 49% in person EDay, 29% in person early, and 17% by mail
- Democrats: 28% in person EDay, 31% in person early, and 33% by mail.
- Republicans intend to vote 67% in person, 27% in person early, and 4% by mail.
North Carolina
- All voters: 49% in person EDay, 33% in person early, 11% and by mail
- Democrats: 22% in person EDay, 48% in person early, and 22% by mail
- Republicans: 74% in person EDay, 22% in person early, and 3% by mail.
Pennsylvania
- All voters: 69% in person EDay, 25% by mail
- Democrats: 42% in person EDay, 48% by mail
- Republicans: 94% in person EDay, 5% by mail.
Motivation to Vote
Voters report being remarkably and extraordinarily engaged in voting this year in comparison to previous years. 92% are a 10 out of 10 in terms of their motivation and 96% are an 8 or higher. 91% of voters of color are a 10/10 with Democratic women the highest at 96% a 10/10. While voters are overly optimistic in predicting their own chances of voting, voters are likely to be extraordinarily receptive to messaging that helps them engage that motivation and intention.
84% have also thought a great deal about how they’re going to vote in the past month and those numbers span demographic groups. 87% believe that their vote definitely matters and when including those who say it probably matters that’s 96% of the electorate. More than a third would even be interested in serving as a poll worker this year if asked.
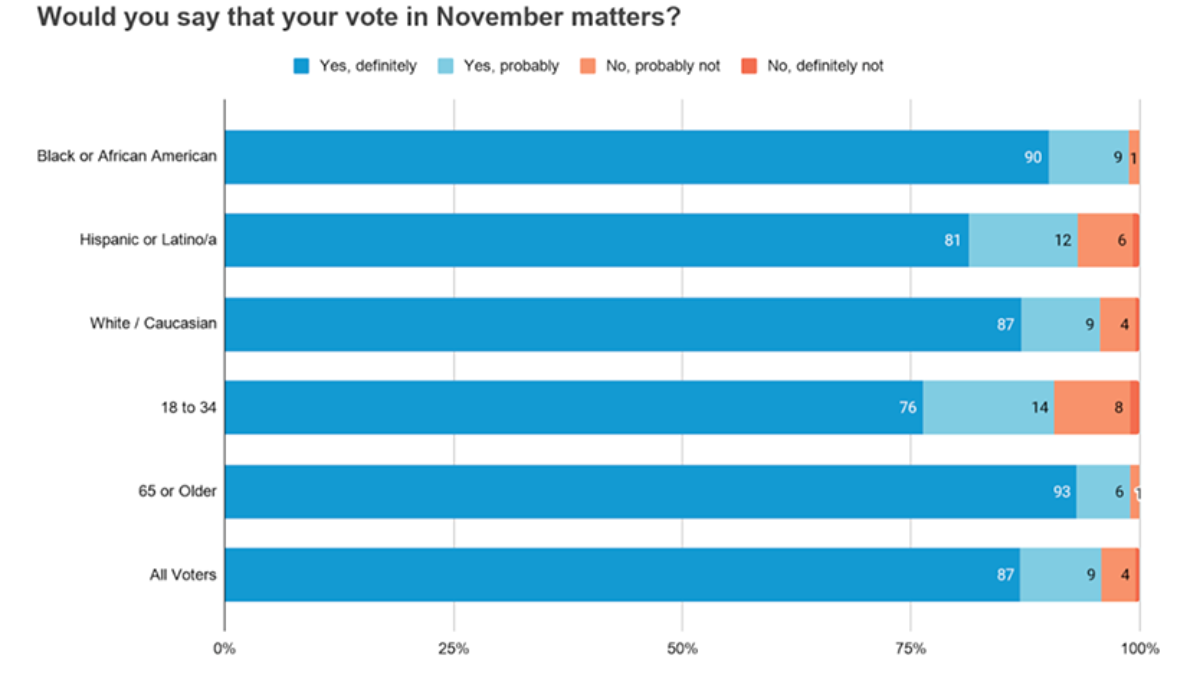
Over 95% of all voters across various demographics believe that their vote in November definitely or probably matters. Likewise, over 95% of voters responded with an 8 or higher motivation to vote in 2020 on a 1 to 10 scale.
Even though 44% of Democrats, and 34% of voters overall say that they have encountered false or misleading claims about voting this year, it has not affected their motivation to vote.
Coronavirus
A 59% majority of voters view the coronavirus as a very serious or somewhat serious concern, with 71% of Hispanics, 85% of African Americans, and 94% of Democratic voters in agreement, but only 28% among Republicans. Likewise, 79% of Democratic and only 23% of Republican believe that the virus will still be a major concern in November.
State-Specific Information
Arizona
Presentation | Crosstabs
Change Research surveyed 1,160 likely voters online across Arizona. Change Research uses Dynamic Online Sampling to recruit a representative sample. Weighting was done on gender, age, race, education, geographic region, and 2016 vote. The margin of error is ± 2.9% for the full sample and larger among subgroups.
Georgia
Presentation | Crosstabs
Change Research surveyed 1,393 likely voters online across Georgia. Change Research uses Dynamic Online Sampling to recruit a representative sample. Weighting was done on gender, age, race, education, geographic region, and 2016 vote. The margin of error is ± 2.6% for the full sample and larger among subgroups.
North Carolina
Presentation | Crosstabs
Change Research surveyed 1,077 likely voters online across North Carolina. Change Research uses Dynamic Online Sampling to recruit a representative sample. Weighting was done on gender, age, race, education, geographic region, and 2016 vote. The margin of error is ± 3.0% for the full sample and larger among subgroups.
Pennsylvania
Presentation | Crosstabs
Change Research surveyed 1,093 likely voters online across Pennsylvania. Change Research uses Dynamic Online Sampling to recruit a representative sample. Weighting was done on gender, age, race, education, geographic region, and 2016 vote. The margin of error is ± 3.0% for the full sample and larger among subgroups.
Share Findings
We are happy to share findings and data free of charge to any organizations.
Please feel free to contact info@publicwise.org.