Redistricting in 2021
How the most recent set of maps could determine control of state legislatures and congress
As mentioned in the first part of this series, the redistricting process occurs following reapportionment, which relies on data from the 2020 US Census. Due to the COVID-19 pandemic, execution of the census survey was particularly difficult and there were large delays in the availability of census data. Specifically, data that was supposed to be made available to the states by March 31, 2021 was not available until the end of September.
Once reapportionment has occurred and states are in possession of census data, redistricting can begin. How states create maps, however, varies widely. There are a number of different methods used to redistrict. Some states use the same method for both state and congressional redistricting, others use different methods for different processes. For simplicity, this piece will focus exclusively on the most recent round of congressional redistricting (though redistricting at the state level is equally important).
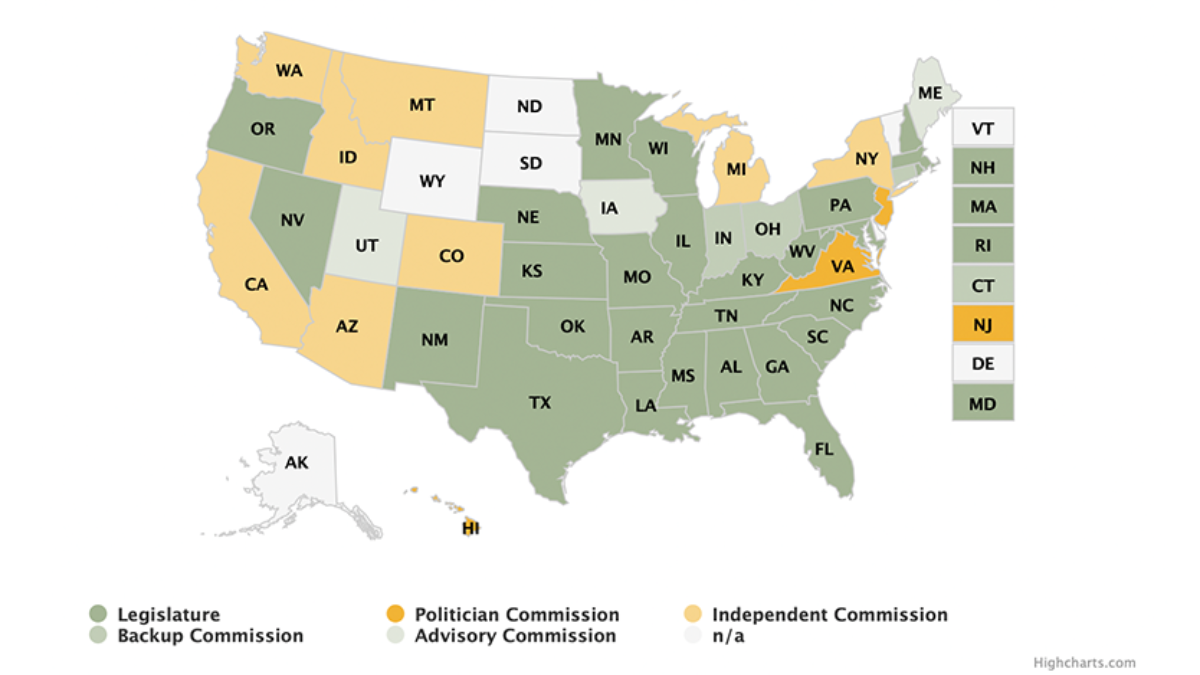
In a majority of states (27), the legislature is in charge of congressional redistricting. This means that the majority party in the legislature determines the district maps. In 8 states, an independent commission determines the district maps and the remaining states use either a political commission, an advisory commission, a backup commission, or do not need to redistrict at the congressional level (states that only have one congressional district).
Because congressional redistricting frequently utilizes partisan entities, the redistricting process is often controlled by a single party. A plurality of maps for the current redistricting cycle (19) will be created by Republicans. 8 will be created by Democrats. 16 will be split and 1 will be nonpartisan (the remaining 6 states do not conduct congressional redistricting).
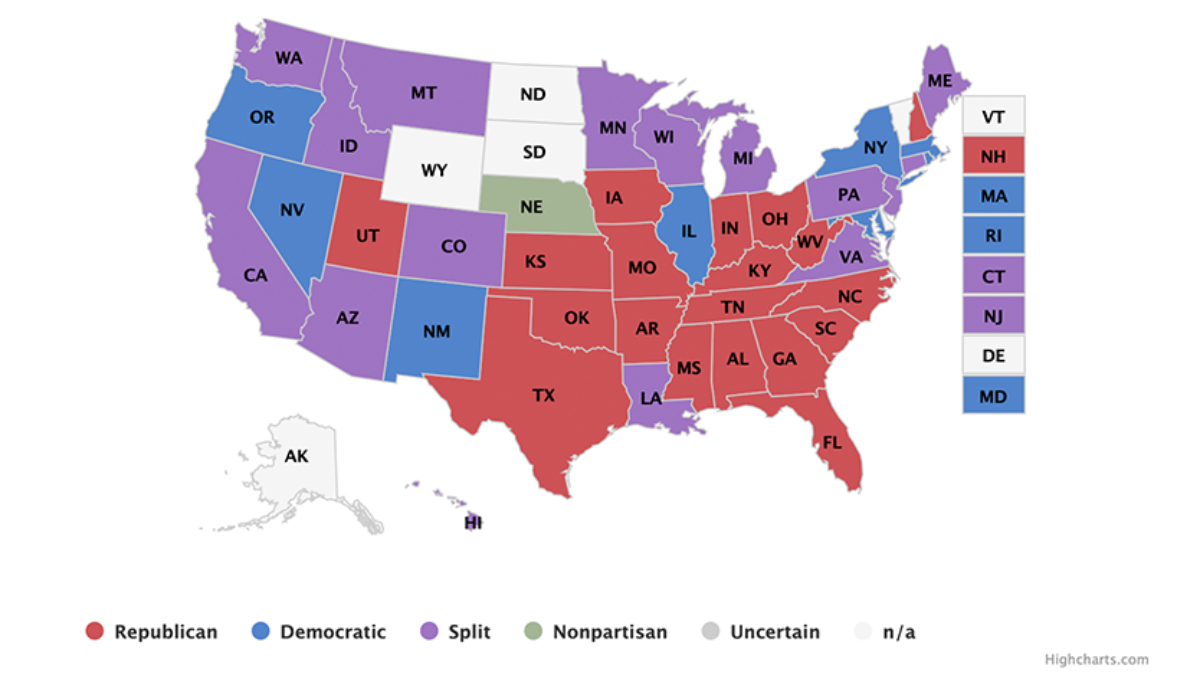
It is important to note why Republicans control redistricting in more states than Democrats. For one, a majority of states in which redistricting is controlled by the state legislature have Republican majorities. Another reason is that independent redistricting commissions and processes that are split between Democrats and Republicans are more common in states with Democratic majorities.
Now that we have established who is in charge of congressional redistricting in each state, we can look at 1) the quality of these maps and 2) what these maps mean for Congress.
The Princeton Gerrymandering Project, a collaboration between Princeton’s Electoral Innovation Lab and RepresentUs, creates report cards for each state and assigns a grade for the maps that are approved. These grades are the product of geographic, competitiveness, and partisan fairness scores. The methodology of the project is detailed here. The project uses an ensemble of maps, where 1,000,000 maps are created by an algorithm abiding by certain criteria to establish the range of possible maps a state could choose. As of this publication, not all congressional maps have been finalized and not all of the maps that have been finalized have received grades.
So far, the Princeton Gerrymandering Project has given only four maps an overall “A” grade: Arizona, Colorado, Michigan, and Virginia. All four were created by a “split” commission and none were created by the legislature. We will talk more about the benefits and drawbacks of different methods of redistricting in our final gerrymandering explainer.
PlanScore, a project of the nonpartisan nonprofit Campaign Legal Center, is also concerned with the “fairness” of redistricting maps. Aimed at increasing transparency, PlanScore assesses maps for bias using four different factors: efficiency gap, partisan bias, declination, and mean-median difference. While it does not provide grades, PlanScore does quantify the bias of proposed and approved maps and is another useful tool for assessing their fairness.
Now is probably the time to mention that there is no perfect map, no single solution that equally weighs all relevant factors and satisfies everyone. For example, the Princeton Gerrymandering Project weighs a variety of qualities and a high score in one category does not mean there will be a high score in another. It is possible, for example, that a highly competitive district is not a particularly compact one, or vice versa. But by considering compactness, county splits, competitiveness, the efficiency gap, majority-minority district creation, and the general partisan breakdown of the state, commissions and legislatures should be able to produce a map that is, on the aggregate, good.
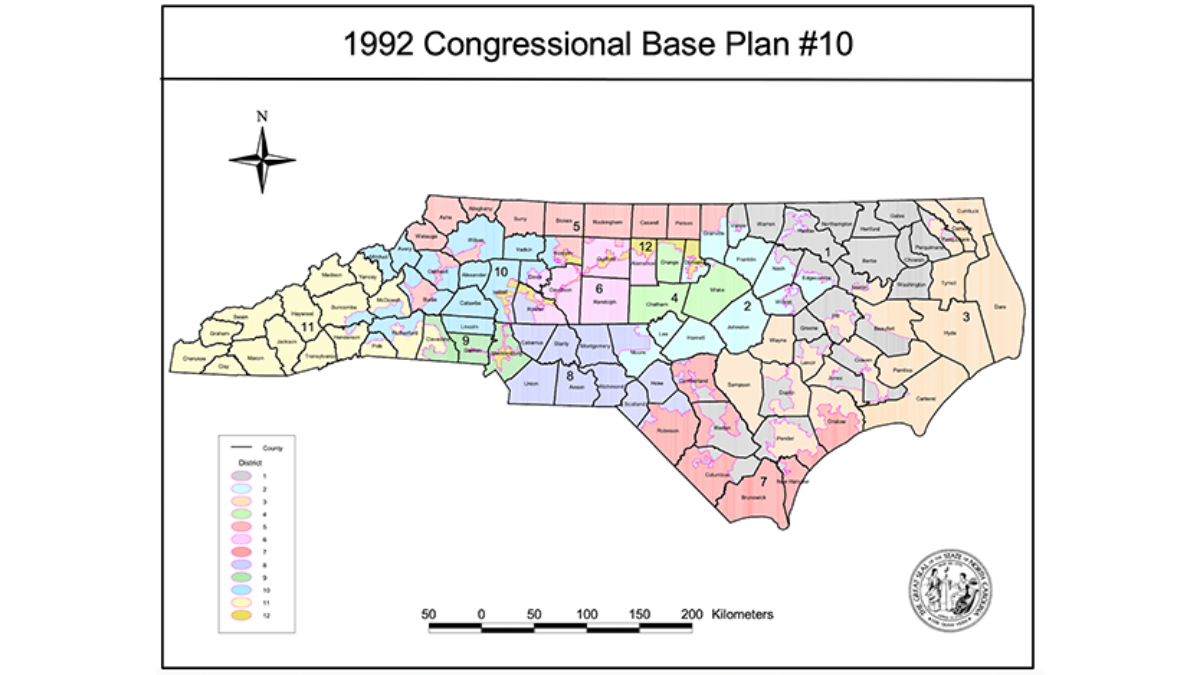
To illustrate this point, let’s look at North Carolina.
In 1991, North Carolina was instructed to draw a second majority minority district by the Department of Justice in order to adequately represent Black voters. The following map was produced and included the 12th district, a majority minority district that linked together Black voters from across the state. This map was challenged in court and resulted in a Supreme Court decision in Shaw v. Reno. The decision found that in certain cases, racial gerrymanders can be unconstitutional.
Conversely, let’s take a look at Michigan.
Following the implementation of an independent redistricting commission, Michigan’s most recent congressional map has been dubbed one of the “fairest” in the country. While the map has its problems, for example more than half of Michigan’s counties are split into different districts and the map still has a Republican lean, it is being heralded as significantly more representative of the state’s politics than previous maps. Most notably, it has a lot of competitive districts, which fits with Michigan’s status as a toss-up state.
The partisan advantages of maps, while small at the state level, can manufacture large advantages for a party in Congress. Redistricting in 2011 heavily favored Republicans to the point where they manufactured a 16 to 17 seat congressional advantage, and with Republicans controlling congressional redistricting in 19 states in 2021, accounting for 187 seats to Democrats’ 75 seats, and many believe the advantage will persist. FiveThirtyEight is tracking maps as they are released and comparing them to the maps created during the last round of redistricting. While not all maps have been finalized, the maps created so far appear to create less of a Republican advantage than the maps made in 2011. Most notably, states are drawing fewer competitive districts than there have been in the past, with parties preferring to sacrifice multiple competitive seats in favor of creating a safe seat.
We will have a better understanding of what Congress might look like a year from now this summer, when all maps are submitted. But until then, you can follow along as states release maps to observe redistricting (and gerrymandering) in action. And in the next and final part of this series, we will discuss the political and social impacts of gerrymandering.