January 6th Survey Dropouts
Understanding Missing Data in Our January 6 Survey
In February 2022, Public Wise and Change Research conducted an online poll of 5,028 American adults to better understand the role of various factors in shaping U.S. public opinion around the January 6, 2021 insurrection at the Capitol. The poll was intended to be broadly representative of the U.S. population. Weights were used to ensure the final analysis was representative according to other available data on the national distribution of age, gender, race, education, 2020 vote, and location (county density and census region).*
Our survey asked various types of questions – first, we asked demographic questions about age, gender, racial and ethnic identity, and location. Next, we asked questions about political affiliations and participation in the recent and upcoming elections. We then asked a battery of questions relating to January 6, a series of questions on more general political ideologies, and then a set of questions focused on views on various conspiracy theories. Finally, we asked a series of questions to assess our respondents’ views on Christian nationalist, ethnonationalist, and other types of nationalist ideologies.
As with most surveys, all respondents did not answer every question in the survey. Thus, some data is missing. But all missing data is not created equal – it is important to understand why data is missing to be able to deal with it correctly.
Missing Data
Researchers think of missing data as being of three potential types:
Missing Completely at Random means there is no systematic reason data is missing. Just as it sounds, here we determine that data is missing purely because of haphazard errors which are totally unrelated to any of the questions our survey is asking.
Missing at Random means that there is a systematic reason some data is missing, but it’s not related to the values for the actual questions where the data is missing. The data is missing for reasons related to some other questions in our survey. For example, if women are busier than men and thus more likely to stop answering survey questions halfway through the survey, this is a systematic pattern for how later data in the survey is missing. But, it is unrelated to the actual answers to the questions that women did not answer.
Missing Not at Random means that an answer someone might give to a question is directly related to how likely they are to not answer a question. For example, if people who believe certain conspiracy theories are more hesitant to answer survey questions about conspiracy theories, we might end up having a case of missing not at random data.
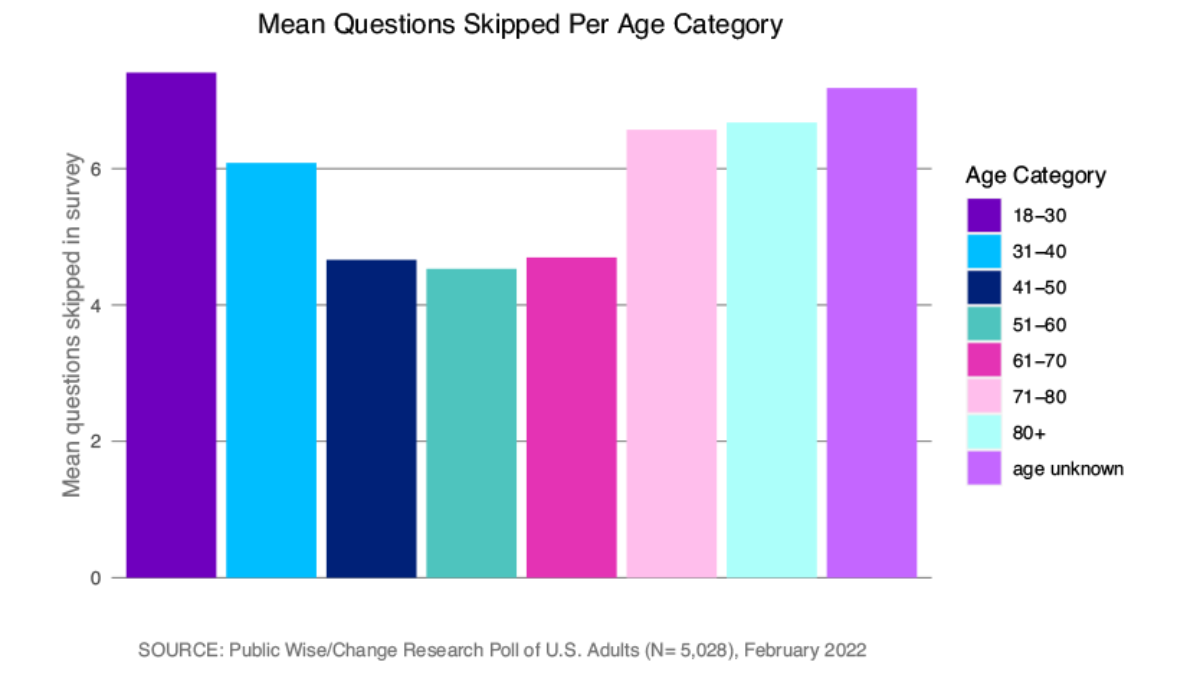
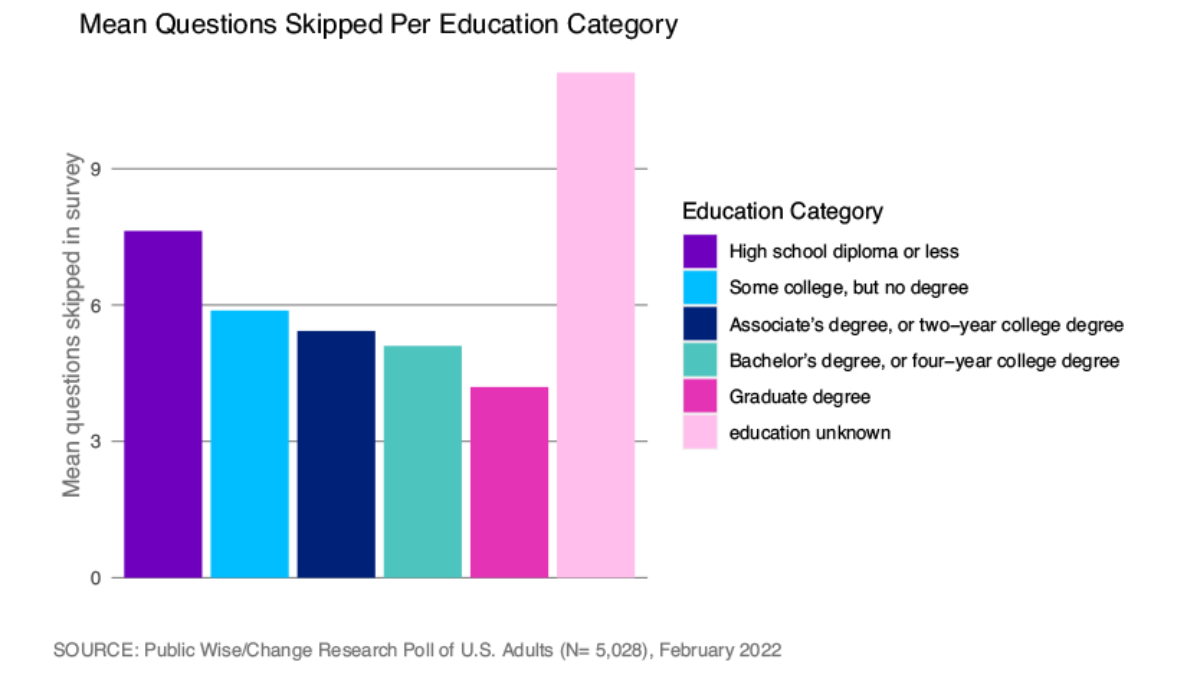
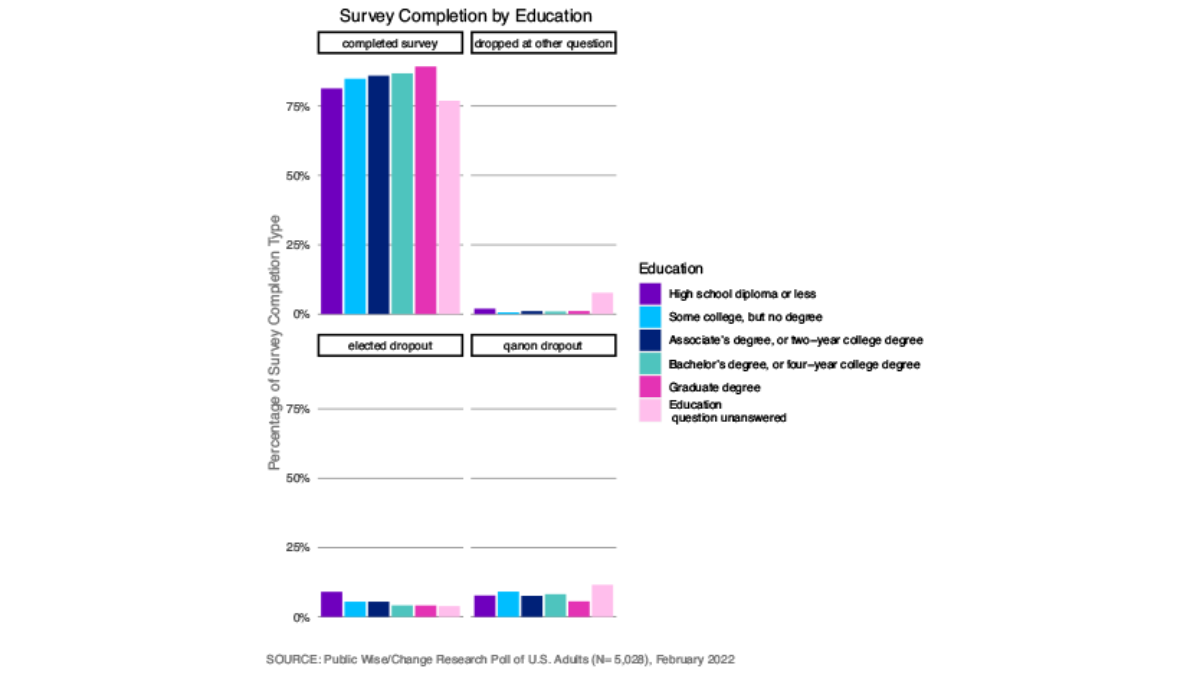
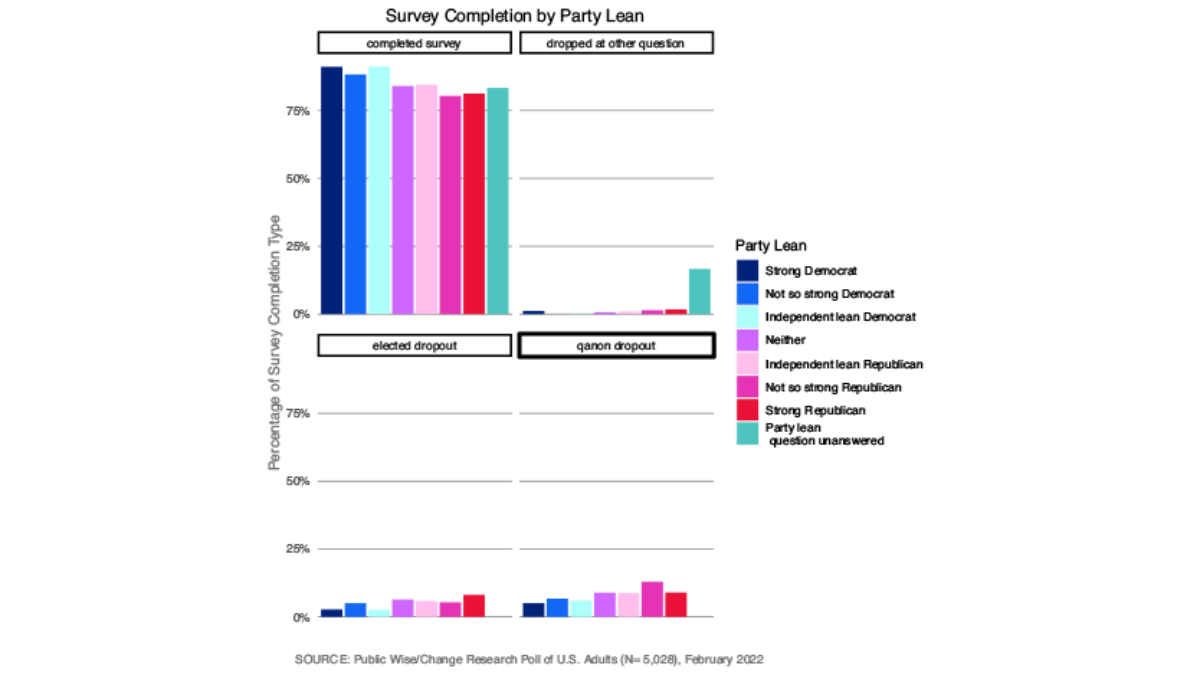
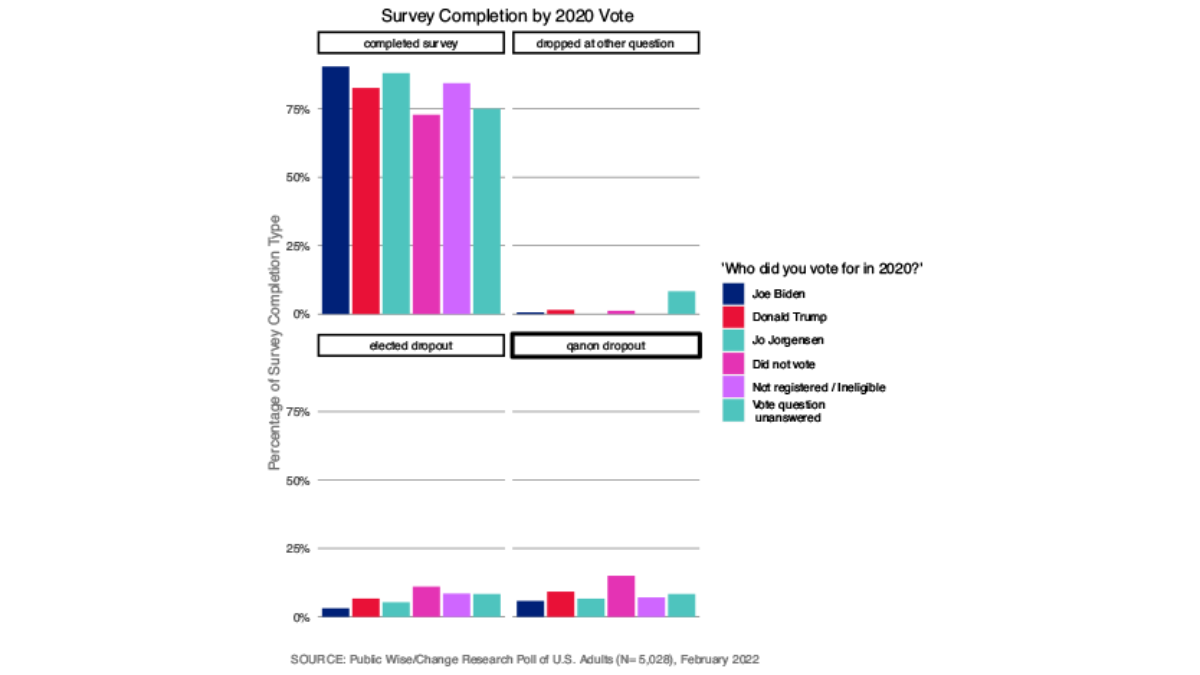
So how can we tell what kind of data we are dealing with? We want to check for patterns in our missing data. Ruling out missing completely at random is the easiest because that’s a high bar. If we see that our data is missing more for certain kinds of respondents and at certain kinds of questions, we can be pretty confident that our data is not missing completely at random. Below, we provide visualizations of the number of missing responses to the survey according to various respondent attributes: age, education, who they voted for in 2020, and party lean. We can see that respondents who were particularly old or particularly young, less educated, nonvoters, and strong Republicans were all much more likely to refrain from answering some of the questions in the survey.
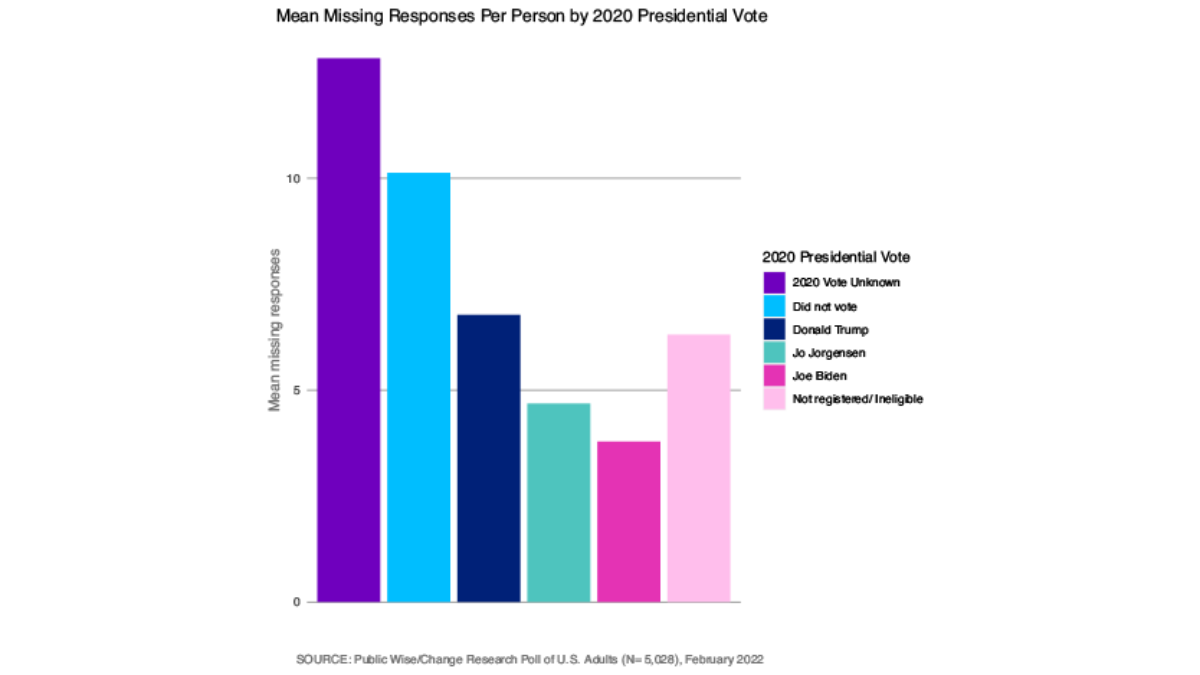
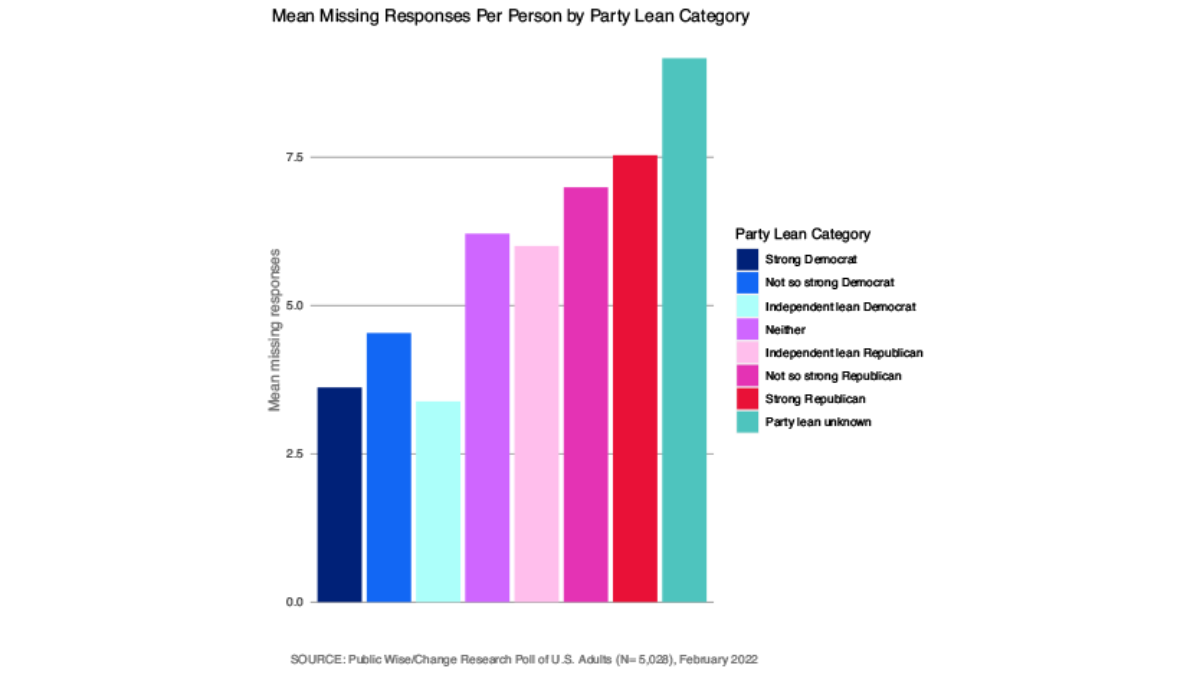
We suspect the data is not missing “completely at random.” But how do we know whether it’s missing at random (data is missing for specific reasons, but the reason is not related to the question we are interested in) versus not at random (data is missing for reasons directly related to the question we are asking)?
The only real way to determine whether we have data that is not missing at random in this case is to use our other observable data and our knowledge of the world (what sorts of relationships we already know likely exist between our questions) to test theories about mechanisms that could lead to missing data (i.e. respondents not providing answers in the survey). It is important to think deeply about the kinds of questions we are asking and why someone might refrain from answering a question.
Quick Links
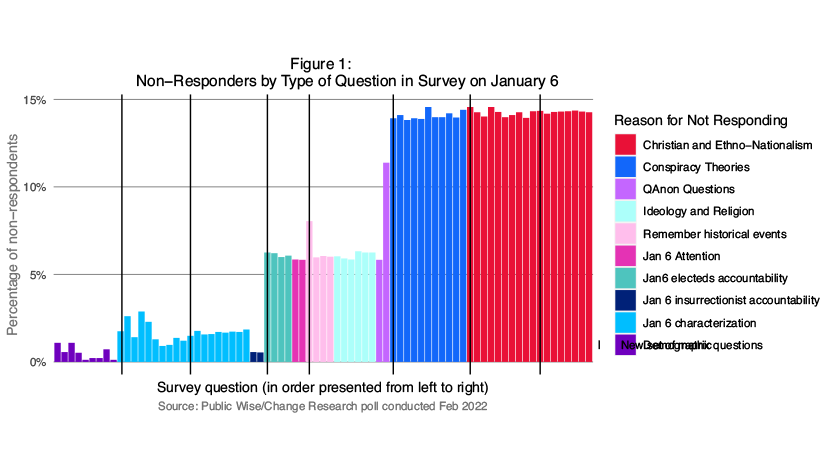
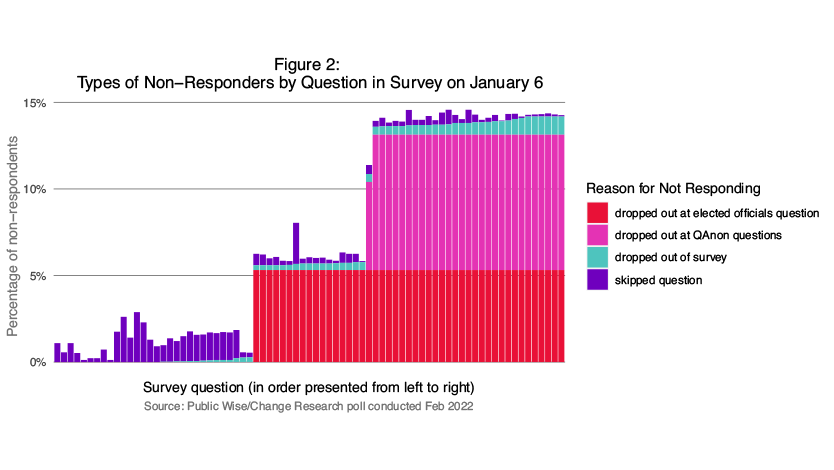
Figure 1 illustrates the percentage of missing data per question in our survey. You can use the quick link to look at the interactive graph to see the individual wording for each question. What is immediately apparent, however, is understanding missing data for a given question is more complicated than looking into who skipped that particular question. That’s because, as respondents work their way through the survey, they might not just create missing data by skipping questions, but by simply not completing anymore of it – dropping out of the survey altogether.
In other words, something a typical technical analysis of missing data might miss is the degree to which missing data is caused by people dropping out of a survey. People’s non-response to a given question may not be driven by the question itself but by a question that came before it in the survey. This was clearly the case with our poll when we dug into the data. In particular, two types of questions caused most of the missing data in our survey, by causing 5% and then 8% of our respondents to stop answering questions altogether.
Quick Links
First, 5% of our total survey respondents stopped answering questions after reaching the question “Do you think an elected official should remain in office if they voted against certifying the election?”** and an additional 8% stopped answering questions after they reached either “How often do you trust Qanon” or the subsequent question which asked for their agreement with the core QAnon theory: “How much do you agree or disagree: The government, media, and financial worlds in the U.S. are controlled by a group of Satan-worshipping pedophiles who run a global child sex trafficking operation.” Around 1% of respondents dropped out of the survey at any other point in the survey.
There is a rich body of work on the problems around different reasons for missing data. Researchers have written, for example, about how to think and deal with the problem of “nonresponse bias”: missing data that happens because individuals don’t take a survey in the first place.*** Other work on survey design and evaluation addresses the question of what to do when data is missing because of respondents who skip a particular question (“item missingness”),**** or because respondents drop out of a study where multiple surveys are conducted on the same sample over time (“attrition”).*****
Relatively less attention has been paid to the problem of data that is missing because respondents dropped out in the middle of a survey around a particular question or set of questions. But other researchers working on surveys with politically or socially sensitive questions might do well to check that they are not facing similar missing data issues around within-survey attrition.
The most obvious explanation for why dropping out in our survey was so concentrated among these particular questions is that they may have been seen by respondents as especially sensitive in some way – perceived as perhaps offensive, dangerous, or embarrassing. All of this suggests strongly that we should see the data in our survey as largely missing not at random. Not only are there patterns to who is missing from the data, but we suspect that those who dropped out at these particular questions have a particular political viewpoint which means that our results, if we simply ignore the missing data, will be biased. To confirm this, we dug into the data to look at how our respondents differed according to whether and where they dropped out of the survey: At the question on elected officials, at the questions related to Qanon, at some other point, or completed the survey.
Demographic Characteristics
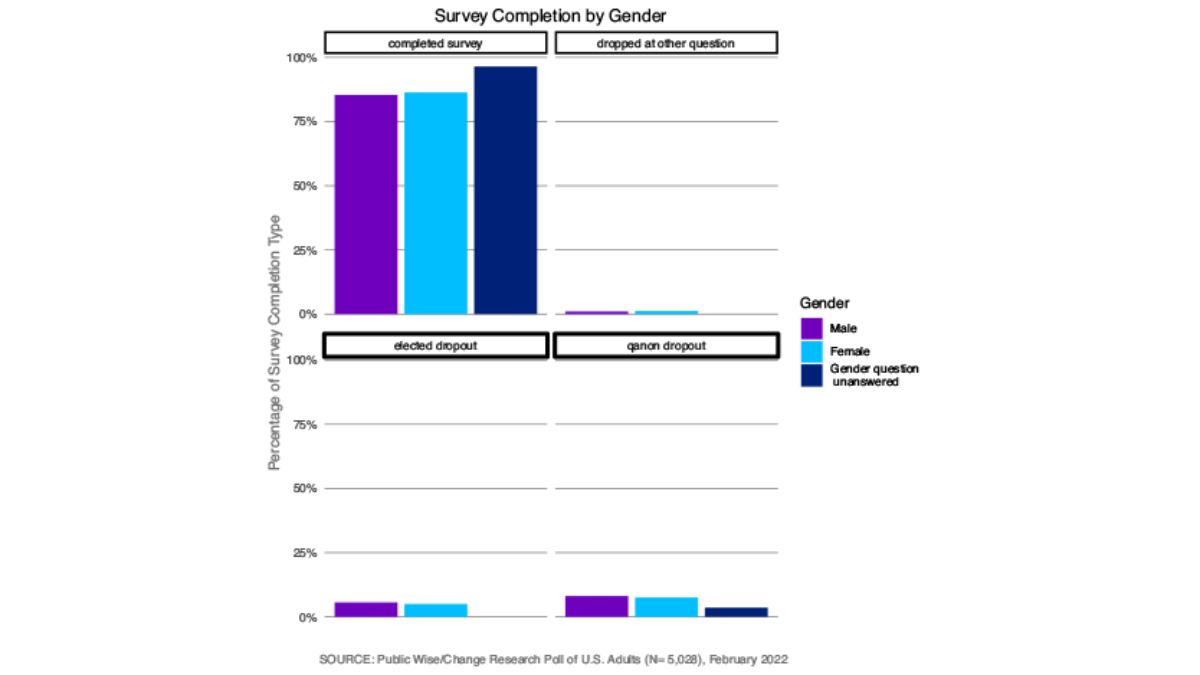
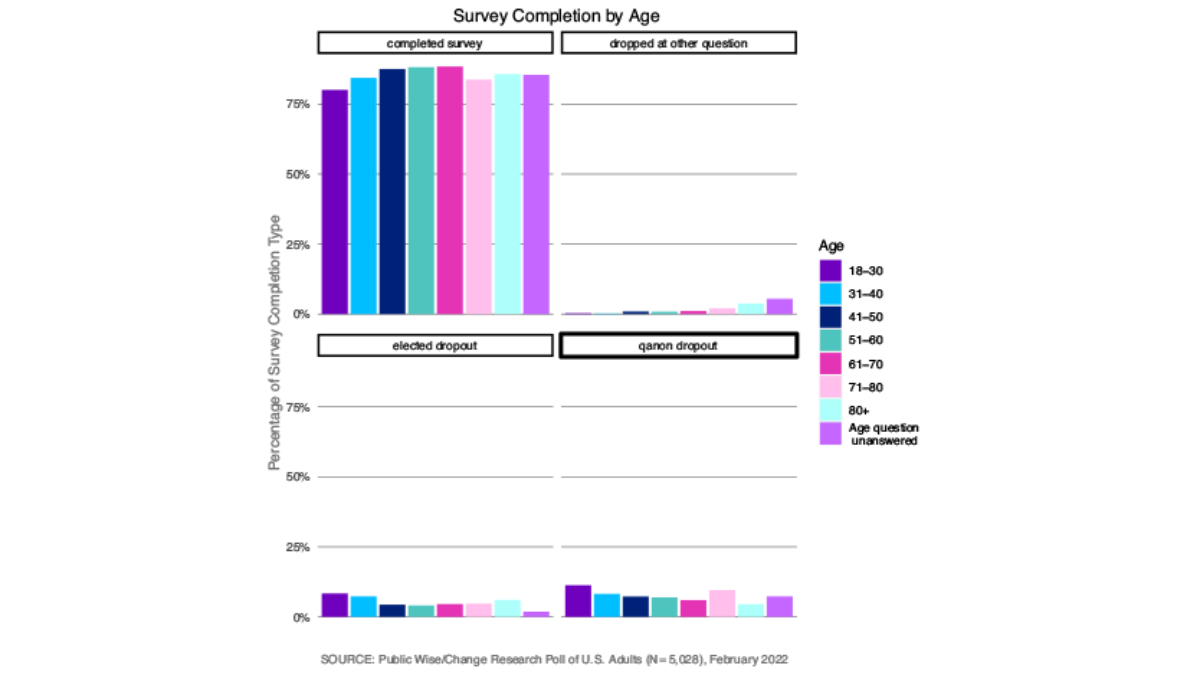
The following graphs show the breakdown of types of survey completion by categories of different variables of interest. We put the different categories side-by-side to compare whether certain types of respondents were more likely to drop out at the Qanon questions, the elected officials questions, other questions, or to complete the survey (which we categorized as everyone who completed up to the third-to-last question).
There was not a clearly defined pattern in regards to gender for the different points in the survey at which people stopped answering questions. Men and women were about equally likely to complete the survey (Figure 3). The very old (71 and over) and young (under 30) were less likely to complete the survey than middle-aged respondents, and younger participants were more likely to drop out at the Qanon question or the elected officials questions (Figure 4). The more education respondents had received, the more likely they were to complete the survey, and those who had not attended any post-secondary school were more likely to drop out of the survey at the elected officials question (Figure 5).
Political Affiliations
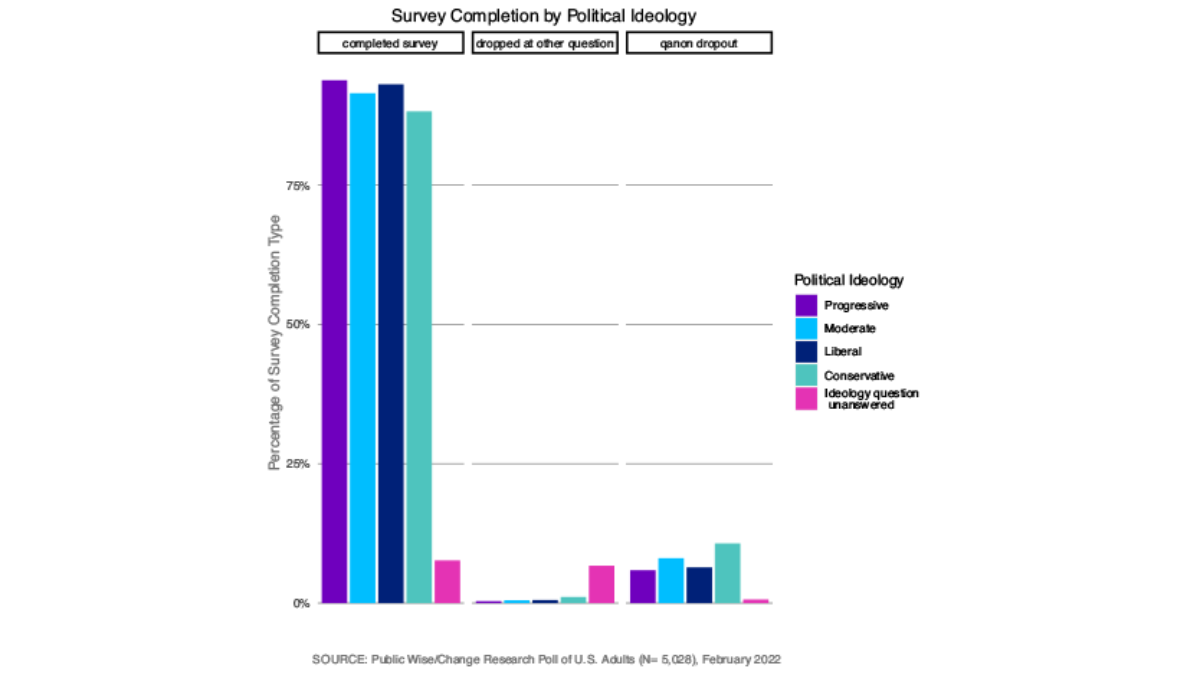
Conservatives were much more likely to drop out of the survey at the Qanon question, and progressives were more likely than any other political ideology to complete the whole survey (Figure 6). Because we asked about political ideology after the elected officials question, we do not know the ideological breakdown of those who dropped out at that question.
Similarly, the self-identified strong Democrats were the most likely to complete the survey whereas Republicans were the least likely to complete the whole survey. Republicans were much more likely to stop responding once they reached the elected official or the QAnon questions, but there was not any clear pattern as to who stopped answering at other points in the survey (Figure 7). Less than three-fourths of respondents who did not vote despite being registered and eligible completed the survey. They were especially likely to stop responding after reaching the Qanon questions. Trump voters were slightly less likely to complete the survey than Biden voters (Figure 8).
Views on January 6
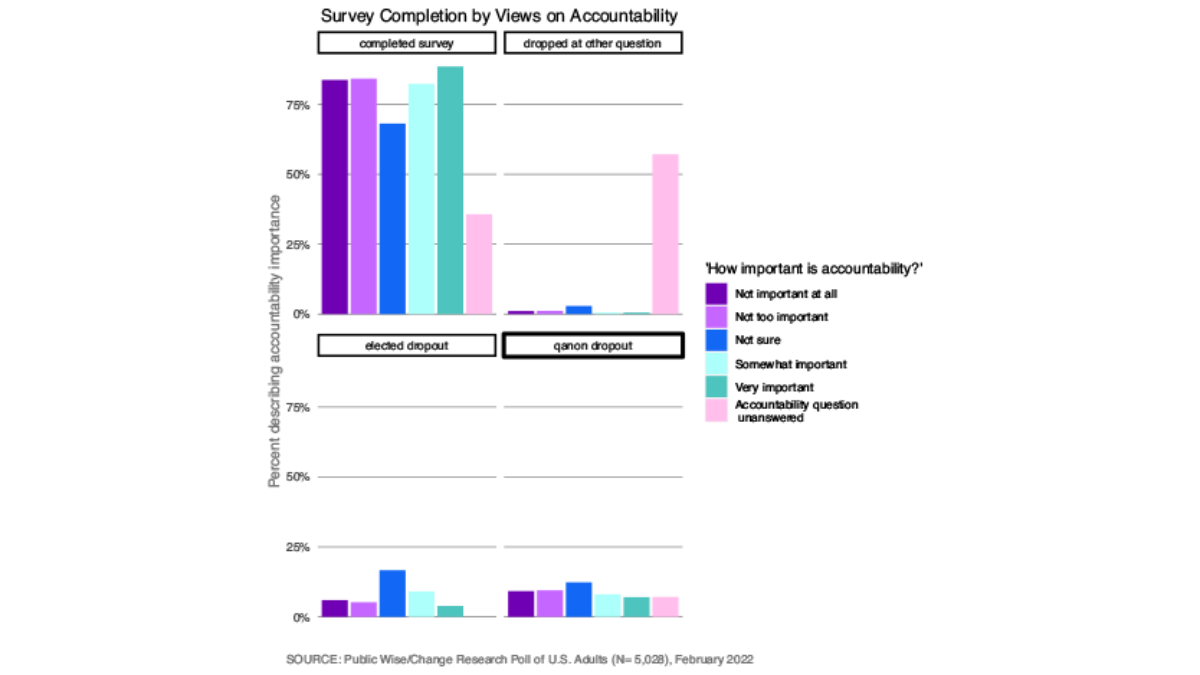
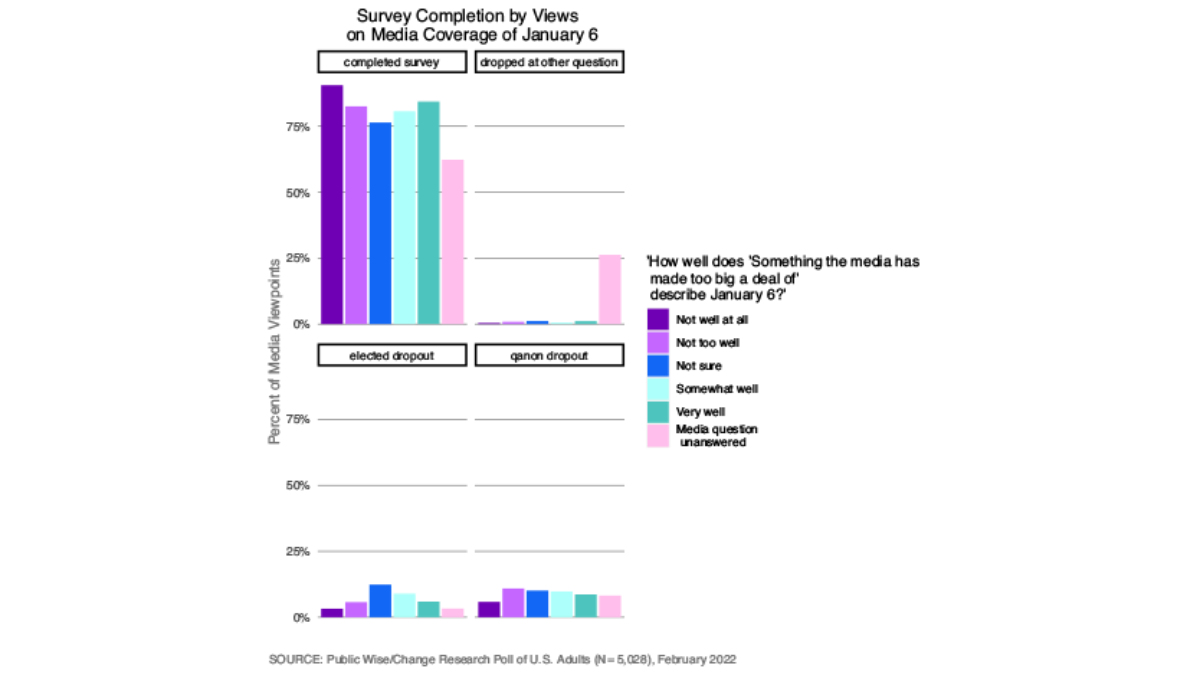
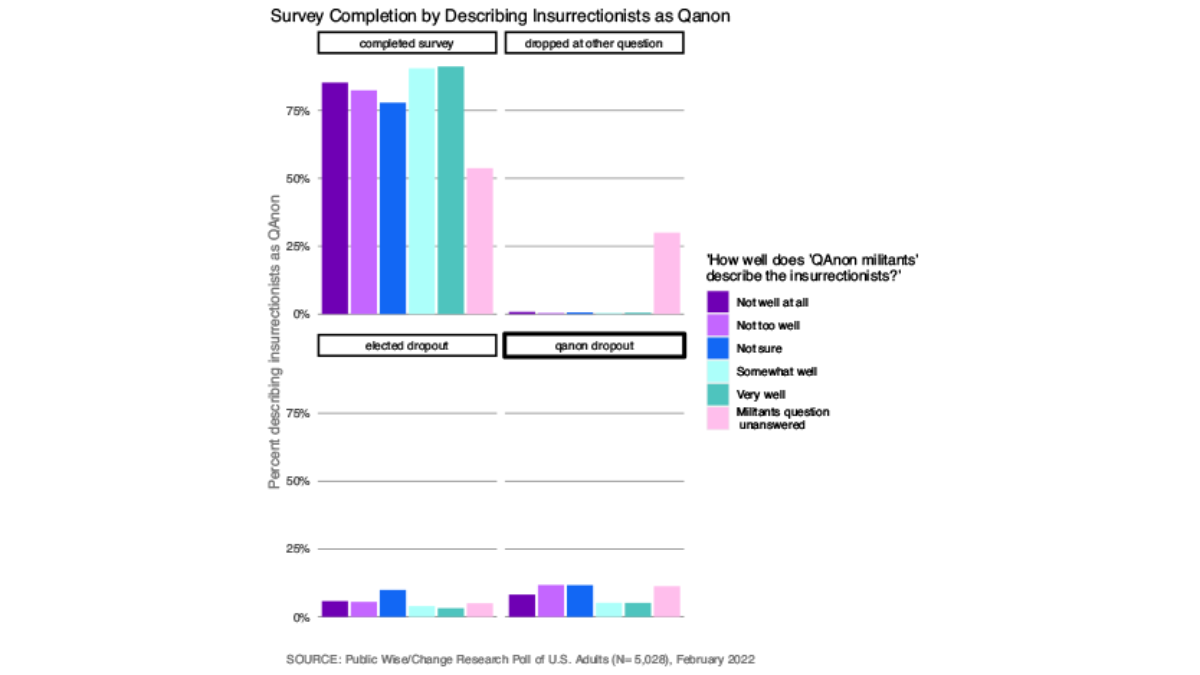
Because our analysis is especially concerned with views around January 6th, we wanted to explore how our missing respondents had answered on January 6th questions before dropping out. Public Wise asked: “How important do you think it is that the people who participated in the events of January 6th be held accountable for their actions if a court determines they broke the law?” Those who were unsure of how to answer this question or who skipped this question were less likely to complete the survey and more likely to drop out at the elected officials question. The majority of those who did not answer this question stopped answering at some other point in the survey (Figure 19). The same was true with our question about how much attention the media had paid to January 6 (Figure 10) and whether January 6 insurrections were Qanon militants (Figure 11). It is possible that those with less strong feelings about January 6 as a whole were less motivated to continue through all of our questions on January 6. Respondents who skipped any of these questions were more likely to dropout of the survey at some point other than the questions on elected officials accountability and Qanon.
Missing Data is Data!
We can be quite confident that our data is missing not at random. Based on the patterns of how respondents answered other questions, it seems probable that our missing data is skewed towards people who are less likely to want accountability for January 6th insurrectionists and elected officials who participated and who may also believe in QAnon theories. So what does that mean?
In many cases, researchers try to just ignore missing data – they drop it from the analysis with a small footnote and move on. This is widely acknowledged to not be ideal because it risks producing biased results, but is common because of its simplicity. Many researchers use what’s called “data imputation” – essentially, replacing missing data with substituted values based on some kind of computational model. But this technique is typically unsuitable for data missing not at random, because without knowing why we have missing data, using imputation can create results which have just as much bias as dropping our missing data altogether (Sterne et al., 2009). Some researchers, when faced with this problem, try to recontact respondents a second time to see if they can recuperate the missing answers.
In our case, we choose to treat the missing data as data itself. We recode our missing data to be treated as its own data category. When we want to understand the relationship between two variables in our dataset, but the response for one of those variables is missing, this at least allows us to see how those who are missing for one variable responded to the questions which they did answer. While we are missing responses regarding views on QAnon for those who dropped out at that part of the survey, we can at least assess whether those who are missing differ in meaningful ways for our questions of interest. We are able to still make use of the missing data to add to our understanding of the issues we are studying. In our future blog posts and white papers using this survey, we will include missing data as a category itself when it is relevant to the analysis.
Academic References
Davern, Michael. 2013. “Nonresponse rates are a problematic indicator of nonresponse bias in survey research.” Health Serv Res. 48(3): 905-912.
Iris Eekhout, Henrica C.W. de Vet, Jos W.R. Twisk, Jaap P.L. Brand, Michiel R. de Boer, Martijn W. Heymans. 2014. “Missing data in a multi-item instrument were best handled by multiple imputation at the item score level.” Journal of Clinical Epidemiology 67(3): 335-342.
Gray, Linsay. 2016. “The importance of post hoc approaches for overcoming non-response and attrition bias in population-sampled studies.” Social Psychiatry Psych Epidemiology 51(1):155-157.
Groves, Robert M., & Emilia Peytcheva. 2008. “The Impact of Nonresponse Rates on Nonresponse Bias: A Meta-Analysis.” Public Opinion Quarterly 72(2): 167–189.
Klaas Sijtsma & L. Andries van der Ark. 2003. “Investigation and Treatment of Missing Item Scores in Test and Questionnaire Data.” Multivariate Behavioral Research 38:4, 505-528.
Parent, Mike C. 2013. “Handling Item-Level Missing Data: Simpler Is Just as Good.” The Counseling Psychologist 41(4): 568-600.
Sterne, Johnathan. A., Ian R. White, John B. Carlin, Michael Spratt, Patrick Royston, Michael Kenward, Angela M. Wood, & James R. Carpenter (2009). “Multiple imputation for missing data in epidemiological and clinical research: potential and pitfalls.” BMJ (Clinical research ed.) 338, b2393.
Wagner, James. “A Comparison of Alternative Indicators for the Risk of Nonresponse Bias.” Public Opinion Quarterly 76(3): 555–575.
FOOTNOTES:
* Weights are based on the voter supplement from the 2020 Census. Recruitment was done online via ads placed on websites and social media platforms. No financial incentives were offered to participants. The final sample consists of respondents who answered a minimum of 12 questions.
** Public Wise conducted a shorter version of this survey in October 2021 and found that a similar percentage of respondents dropped out at the elected officials question. We did not ask questions related to QAnon in that version of the survey.
*** For examples, see Groves and Peytcheva, 2008; Wagner 2012; and Davern 2013
**** For examples, see Parent 2012; Sijtsma and van der Ark 2003, Eekhout et al. 2014.
***** For example, see Gray 2016.
