The Problem of Polling
After the last two presidential elections, there was a lot of public rhetoric about the problems with polling. Article after article lamented the failures of public polls to accurately predict the outcomes of recent elections. But the truth is that polls have been wrong many times before 2016. Let’s not forget the Dewey Defeats Truman debacle of 1948. Now that another election is upon us, along with rampant debate about which polling data to trust, it is a good time to take a sober look at the art of polling. Rather than railing against one form of data collection for its inability to perform beyond its capabilities, we should reevaluate our continued insistence on expecting polls to accurately predict the future and reckon with the disconnect between what we want polls to tell us and what they can tell us.
In order to evaluate the problems with electoral polling, we need to first consider exactly how polls are taken and what they can measure. You can read more here for our in-depth tips on how to read a poll, but here are the basics of how they work. For any poll, the pollster first needs to determine what population they want to investigate. In the US, sometimes the population of interest is the general adult population. For electoral polls, the population is usually either registered voters or likely voters. Likely voters generally refers to people who either say they are likely to vote or who are considered likely because voting records show that they have voted in several previous elections. Once the population of interest has been defined, the pollster then has to take a representative sample of people from within that population.
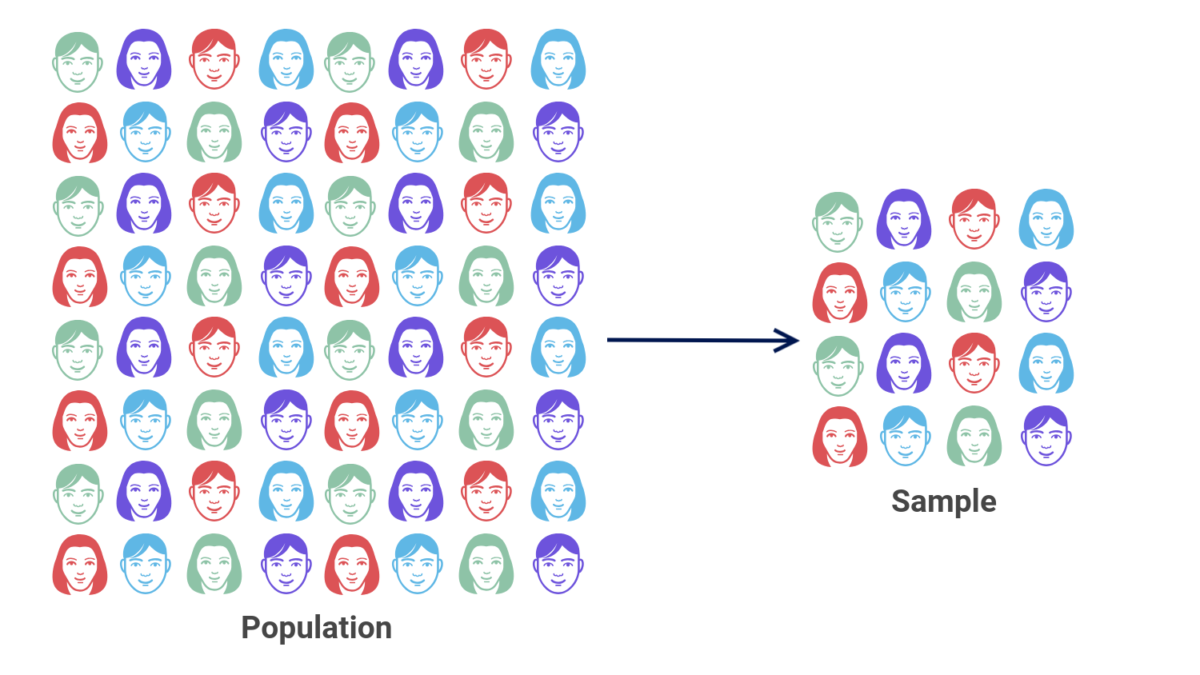
Why a sample? Generally the population of interest is composed of millions of people. The time and resources required to ask questions of millions of people make it impractical to impossible, so we ask the questions of a sample of that population instead. Now, what do we mean by representative? A representative sample is one that ideally includes people who represent the full diversity of the population we are interested in studying, including racial/ethnic, gender, age, educational, partisan/ideological, and regional diversity, among other attributes that may be correlated with research questions. Generally we also want our sample to be random, meaning that any one person in the population has an equal chance of being selected for the sample as any other person in the population. In other words, in a well done sample there is no systematic bias determining who gets into the sample and who doesn’t. If you are thinking right now “this is crazy, there is no practical way to make sure that every single adult in the US, or every single registered voter, has an equal chance of getting into a sample just because of sheer logistics,” don’t worry. There are lots of different sampling methods that polling firms use to get a representative sample. While they appear to generally work well, polling methods are evolving rapidly, making it difficult to fully assess the relative merits of each. There are lots of different sampling methods that polling firms use to get a representative sample, and for the most part they work quite well.
Once a sample has been selected, the polling firm asks the selected people to participate by answering questions. The answers are collected and then the sample is weighted. Weighting is a procedure where pollsters take account of who did and did not respond to the survey, compare it to what they know the population looks like, and if some types of people are underrepresented in the responses they might give their responses a little more weight so that the sample can be representative of the full population.
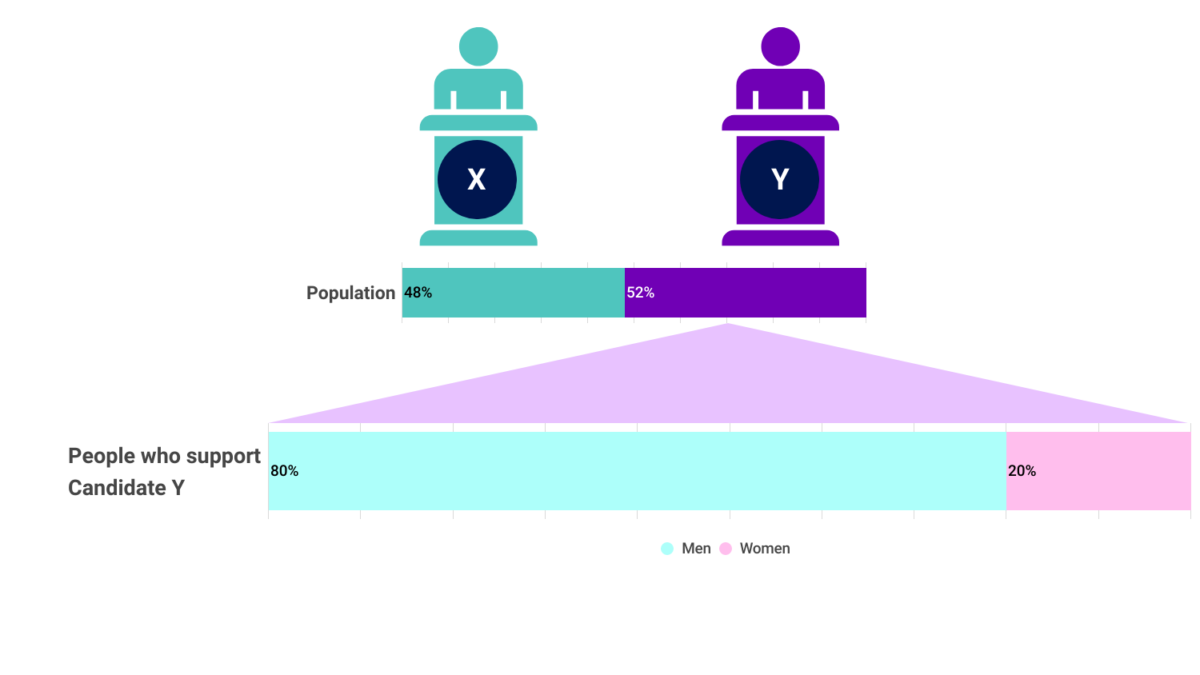
Once the responses are in and the weights are applied, the polling firm or researcher can produce toplines and crosstabs. Toplines are the percentage of all respondents who answer in each category for each question. Crosstabs are a way of looking at how people answered based on some other characteristic. So for example, a pollster might ask all the respondents who they plan to vote for in the next election. The topline will tell you that 48% say they plan to vote for candidate X while 52% plan to vote for candidate Y. But maybe you think that candidate Y’s support is mostly coming from men. A crosstab (short for cross tabulation) of the answers to who people plan to vote for and their gender might show you that of the 52% of respondents who plan to vote for candidate Y, 80% of them are men.
The final part of the process is calculating the margin of error. Because the poll is taken from a sample of the population, it can only be an estimate of the opinions within the larger population. Each poll has an estimated margin of error which tells anyone reading it how much the estimate of the percentage of people with each opinion might be off from the real percentage in the population as a whole. The calculation for the margin of error takes into account the size of the sample relative to the true population size and the amount of overall error we are willing to tolerate, among other things. Most margins of error are based on the idea of 95% confidence – they tell us the range our estimate is expected to fall within 95% of the time. Larger margins of error indicate less certainty in our estimate.
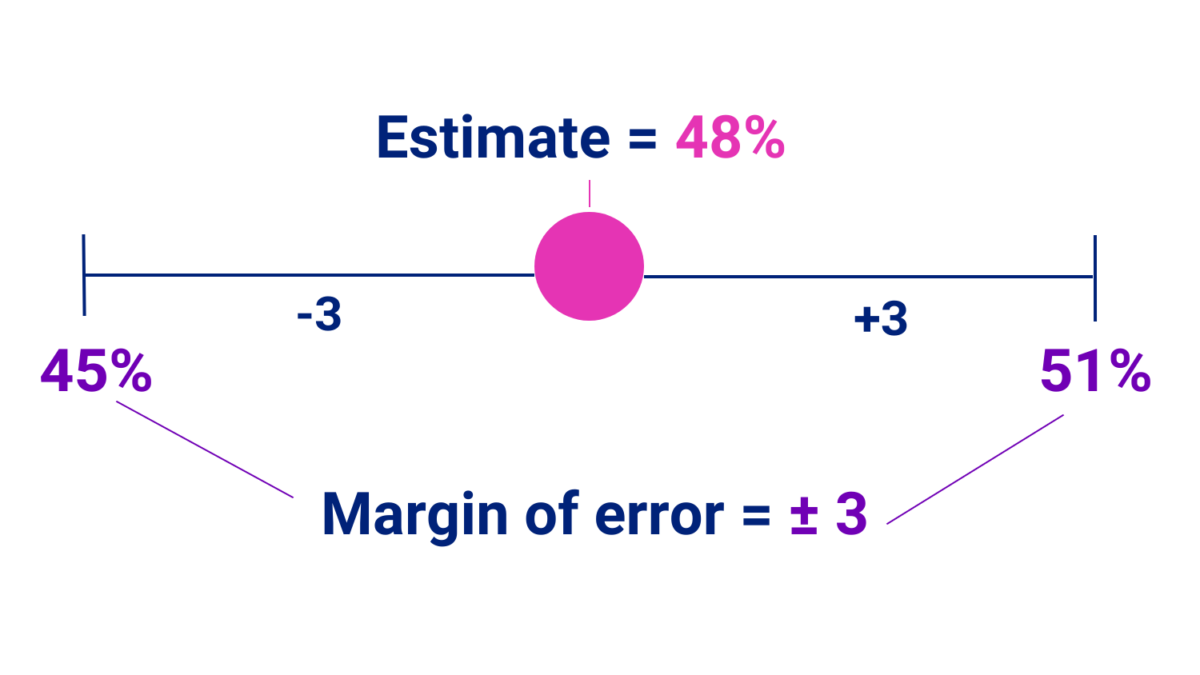
So to go back to our candidate X and Y example, the reported percentage of people who say they plan to vote for candidate X is a best guess of the percentage of people in the population who plan to vote for candidate X and the margin of error is a range that we expect the real percentage to fall in. If the estimate is 48% and the margin of error is 3 that means our best guess is 48, and that if we were to conduct the poll many more times, 95% of the time, the estimate would fall between 45 and 51. Note that the margin of error listed for most polls applies to estimates listed for the total sample. Estimates for sample subgroups (e.g. racial/ethnic, gender, partisan/ideological, etc. groups) will generally have a larger margin of error than the total sample.
So in an ideal situation, where everything in the poll worked right — i.e. the sample is large enough and accurately representative of the population — the margin of error provides a range of values that will contain the actual value for the percentage of the population that will vote for candidate X and with a best guess value within that range given the current sample. The 95% confidence interval tells us that if we conducted the poll repeatedly, say 100 times, the estimate would fall within that range of values 95 of those times. The fact that we can actually estimate facts about a population from a good sample is amazing. It means we can find out all kinds of things about what people think without having to ask everyone in the country. And generally this works very well for public opinion polling or any polling that is trying to estimate the opinions of the general public. But there are problems that can arise that can either increase our uncertainty about the estimates or bias the estimates so that they appear reasonably certain but are actually off in systematic ways.
One major issue facing electoral polls is the problem of actually recruiting a representative sample depending on the target population. With a general population poll, sampling is relatively straightforward. We know what the general population looks like in a snapshot every 10 years from the Census, and (problems that may arise from the 2020 Census notwithstanding) the Census Bureau has very good techniques for estimating what the general population looks like in the in-between years. The challenge for electoral polls is that the population we want to know about is the electorate, but especially the people who are actually going to come out and vote. And the problem is that we need to estimate what the voting electorate will do, but we need to estimate it before we know who the voting electorate actually will be. We won’t actually know who shows up to vote until the election but we want to try to determine what they will do before they do it. So we have to use statistical models to guess what the voting population will look like. This means that a sample meant to be representative of the population of likely voters is actually representative of an estimated population. If the estimate of the population of likely voters is off from the true population of people who are likely to vote, so too will our sample and our weighting be off. And if our sample and weighting are off, then what looks like a reasonably certain estimate of what likely voters will do is really just a guess at what an imaginary population will do.
Another issue is one that is referred to as non-response bias. This one is tricky because it can wreak havoc on its own or in conjunction with the problem of estimating a population based on predictions of what people will do in the future. Non-response bias refers to a bias in a sample when particular kinds of people either refuse to participate in a survey or can’t be found to participate in the first place. The part of the population that the survey fails to account for will differ depending on a number of factors. For a web-only survey, nonresponse bias is likely to affect people with limited access to the internet – either they can’t be contacted or they refuse to participate due to limited resources. For phone-only surveys, nonresponse bias will affect those who don’t have steady access to a dedicated phone number. Some surveys will suffer from nonresponse bias due to their subject matter – some members of the population of interest may simply refuse to answer questions about certain topics. And in our current environment of low trust and high skepticism, it is possible that some people will refuse to answer questions no matter the topic because they are wary of any interactions with strangers asking for information either over the phone or on the internet. Regardless of how a survey is fielded, it can also be difficult to reach and recruit (enough) individuals from groups that represent smaller shares of the US population, which can lead to non-response bias for those groups as well.
According to a report by the American Association for Public Opinion Research (AAPOR), nonresponse bias may have been behind inaccuracies in the 2020 election polls. Based on their analysis, the prime suspect for problems with 2020 polling was that key groups did not respond to the polls. They point out, for example, that the people who were more likely to vote for former President Trump were also more likely to distrust institutions and, therefore, wouldn’t be inclined to respond to pollsters. This would have left that segment of the voting population unaccounted for in the poll results, thereby underestimating support for Trump. If this was the case, then the Republicans that pollsters were talking to in 2020 were measurably different from the Republicans who didn’t not respond to pollsters. The AAPOR points out that we can’t be sure if this is the real problem because it is an unknown unknown. We don’t know what we are missing, precisely because we are missing it. Their analysis did, however, rule out respondents lying to pollsters either about who they favor or about their intentions to show up and vote.
David Shor floated a similar hypothesis about why polling has seemed more off in recent years. He points out that the people who respond to polls are weird – they are the type of people who pick up the phone when an unknown number calls, but also are willing to stay on the phone long enough to answer questions asked by a complete stranger and are trusting enough not to think the pollster is trying to scam them. Given these characteristics, they are likely not all that representative of the greater voting public. If this is the case, then weighting is not really going to help all that much. You can’t weight a sample to include the opinions of people who don’t exist at all in your sample – you can only weight a sample to boost the opinions of people who exist but are underrepresented. Shor asserts that the problem lies in the fact that low-trust people who don’t respond to polls used to be pretty evenly split between the two parties. But starting around 2016, the low-trust non poll responders started being more likely to be people who vote for Republicans. If this is correct, then polling in general will continually underestimate support for Republican candidates.
Which brings us back to the main issue: what are polls actually good for? A lot of things actually. Pew Research addressed this very question in a great piece in March 2021. They did an analysis to determine the extent to which issues with polling accuracy signaled issues with other kinds of opinion polling. They found that for the most part polling remains a great way to measure public opinion on many issues. First, there is a lot more diversity among partisans about issues than there is about candidate preference. While candidate preference tends to be highly correlated with opinions on social issues, due to the large amount of variation in opinion among people of the same party or ideology on specific issues it turns out that the problems that lead to inaccuracies in predicting how an election will turn out don’t seem to have much impact on predictions of public opinion on issues, policies, or other matters.
Another reason we should still be able to trust public opinion polling has to do with the amount of error we can reasonably tolerate in an opinion poll versus an electoral poll. Think about it this way, when you are polling for an election, a two, three, or four point difference could mean the difference between correctly predicting who will win and being flat out wrong.
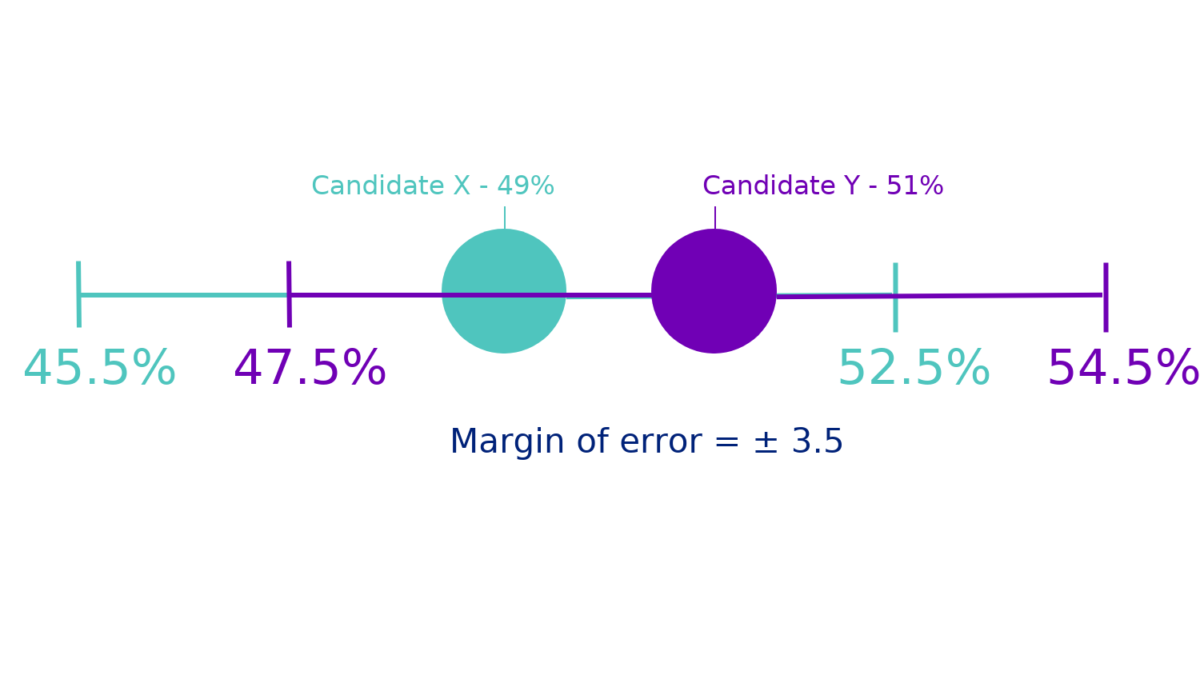
Take the example of a poll that says candidate X is estimated to win 49% of the vote and candidate Y is estimated to win 51% of the vote. In this case there is a three point difference and candidate Y is predicted to win. But let’s say the poll has a 3.5 point margin of error. The difference between candidate X and candidate Y is actually within the margin of error, which means it’s as good as a coin flip who will win as far as the poll is concerned. But the reporting on the poll focuses on candidate Y’s 51% and says the poll predicts that candidate Y will win. If candidate Y loses, the poll was “wrong” according to the reporting, but in reality the poll couldn’t make a definitive prediction. It could only estimate a best guess within a range and the ranges for the two candidates in this case overlapped.
In a public opinion poll, a three point difference doesn’t really change the overall picture we get of how much support a policy might have or how many people are worried about a particular issue. In other words, public opinion polling and other kinds of social surveys can tolerate a lot more error than an electoral poll, and there are generally lower stakes if the poll is off from reality by a few points in either direction. If a public opinion poll says that 49% of people support a particular policy and 51% of people oppose it, then we say the public is basically evenly split on that policy. We don’t turn it into a horse race and say the group with the higher percentage is “winning.”
So where does that leave us? We need to take a good look at what polling can and can’t tell us. Polls can tell us the opinion of people in the moment, fairly accurately. Polling can tell us what people believe they will do in the future. But polling can’t tell us what people will actually do in the future. And polling also can’t tell us what people we never reach with the poll think or will do. Polling should be one piece of evidence that gets used in conjunction with evidence gathered using other methods and sources to paint a picture. Polling should not be used to predict outcomes, and estimates of support should not be taken as probability. If 35% of the likely voters sampled in a poll say they will vote for candidate X and 65% say they will vote for candidate Y, that does not mean that there is a 65% chance that candidate Y wins the election.
Individuals who run polls and write about polls should also take a long hard look at how they explain their results to the general public. Polls should not be reported as definitive predictions. Polls should not be reported with the margin of error buried at the end. And definitely polls where the support for opposing candidates is measured within the margin of error should not be reported as the person with two more percentage points is likely to win.
Polls are an important tool for understanding the political landscape, be it electoral or public opinion. But they are not an all purpose tool. We need to stop trying to make them one. Instead, we should see electoral polls as one piece of a larger puzzle. Does a poll show something scary or that doesn’t make sense? Look at it within the larger context of all the information that is available. First use all the tips in our how to read a poll explainer to evaluate the poll you are looking at. If the margin of error is big and the estimates fall within the margin of error, take the information with a grain of salt. If the swing from one month to the next among a particular subgroup is surprisingly large, see how many people in the sample fall into the subgroup. If the number is really small, recognize that the estimate probably has a lot of error. The smaller the group, the larger the margin of error will be.
Once you have evaluated the poll, look for other sources of information to place the poll in context. For organizers, consider the information you may have gathered on the ground. The same thing that makes relational organizers well positioned to make an impact in their communities also makes them well positioned to gather information from groups that might be otherwise underrepresented or left out of polls. Don’t discount observations from the field. Taken together, qualitative data from the field and quantitative estimates from a poll can provide a more detailed picture of what’s really going on.
Finally, we should all take a long hard look at the problems with polling and reflect on their broader social and political implications. The lack of trust that keeps some people from participating in polls reflects a deeper problem of trust in institutions that has real implications for our democracy. The people left out of polls are likely the same ones that feel left behind by many of our social institutions and who have fallen through the holes of the social safety net. This distrust extends not just to polling, but to voting as well. We won’t really be able to fix polling until we can start to fix these deeper problems. And isn’t fixing those deeper problems what democracy work is supposed to be about in the first place?