Battleground State Voters’ Reactions to January 6th Hearings
Public Wise/Change Research Battleground Poll on January 6th Events
Poll of 4,241 registered voters1 in six battleground states (state margin of error in parentheses):
Arizona (±4.9)
Georgia (±5.3)
Michigan (±4.5)
North Carolina (±4.6)
Ohio (±4.3)
Pennsylvania (±3.7)
Fielded online August 20-31, 2022
Poll paid for by Public Wise 501(c)4. Poll fielded by Change Research. Data analysis by Public Wise Research and Education Fund 501(c)3.
In October 2021 and February 2022, Public Wise conducted nationally representative polls with Change Research to understand public opinion around the events of January 6th, 2021. Both polls asked about a variety of topics related to January 6th, including questions on accountability for elected officials and other participants.
In August 2022, Public Wise conducted another follow-up poll focusing on public opinion about January 6th in six key battleground states. This poll extended many questions from the October 2021 and February 2022 surveys and added several new questions about the January 6 Congressional Committee’s investigation, participation in the events of January 6th following new evidence from the committee’s hearings, ideological positions, and media consumption.
In this memo, we present key takeaways and correlations from our August 2022 battleground state poll. For simplicity, we mostly focus on the pooled sample of all six states, however when states differ, we also include results for individual states. All results use weights that were calculated in two stages: First, each state was weighted according to the demographics of their registered voter population by gender, age, education, race/ethnicity, 2020 vote, and region. Second, weights in each state were then scaled to reflect the size of their registered voter population relative to the other states.
Similar to our previous polls, we find that accountability is important to a majority of registered voters in these six battleground states. However, the importance of accountability varies by party identification and ideological views. Although a majority of registered voters are paying attention to the Congressional Committee’s hearings, views on the credibility of the information coming out of the investigation are highly polarized. Most registered voters in these six states report being highly motivated to vote, especially those who are paying “a lot” of attention to the January 6th hearings. High motivation to vote is driven by older registered voters for all party identifications and ideological views.
Key Takeaways
- Accountability for January 6 is important to a majority of registered voters in these six battleground states: 68% said that it is important that the people who participated in the events of January 6 be held accountable if a court determines they broke the law.
- Support for accountability is stratified by partisan identification: While 98% of self-identified Democrats thought accountability is important, just 40% of Republicans agreed.
- 67% of registered voters in these six states say an elected official should not remain in office if they coordinated with protestors in advance to help them understand the Capitol building and how to move within it quickly, including 95% of Democrats and 40% of Republicans.
- 83% of registered voters in these six states said they would not vote for a candidate that participated in plans to allow fake electors to cast votes during the electoral vote counting on January 6th, including 97% of Democrats and 72% of Republicans.
- 63% of registered voters in these six battleground states have been paying a lot of attention or some attention to the January 6 Congressional committee hearings. Voters with the highest likelihood of voting were much more likely to have reported paying “a lot of attention” to the hearings.
- Views on the credibility of the January 6 committee hearings were polarized, with 40% of registered voters in these six battleground states finding them to be “very credible” and 28% “not credible at all,” and this was highly correlated with partisan ideology.
- 42% of registered voters in these six battleground states were “much more” motivated to vote after the January 6 hearings. Republicans and Democrats were equally likely to say that they were “much more motivated to vote” after the hearings (47 and 48%, respectively), however Republicans were slightly more likely to say they were “not any more or less motivated to vote” (42%) than Democrats (35%).
- 72% of registered voters in these six battleground states reported being motivated to vote at a level of 10 on a scale of 0 to 10 with older registered voters being the most likely to report being at a level of 10.
Accountability for January 6th participants
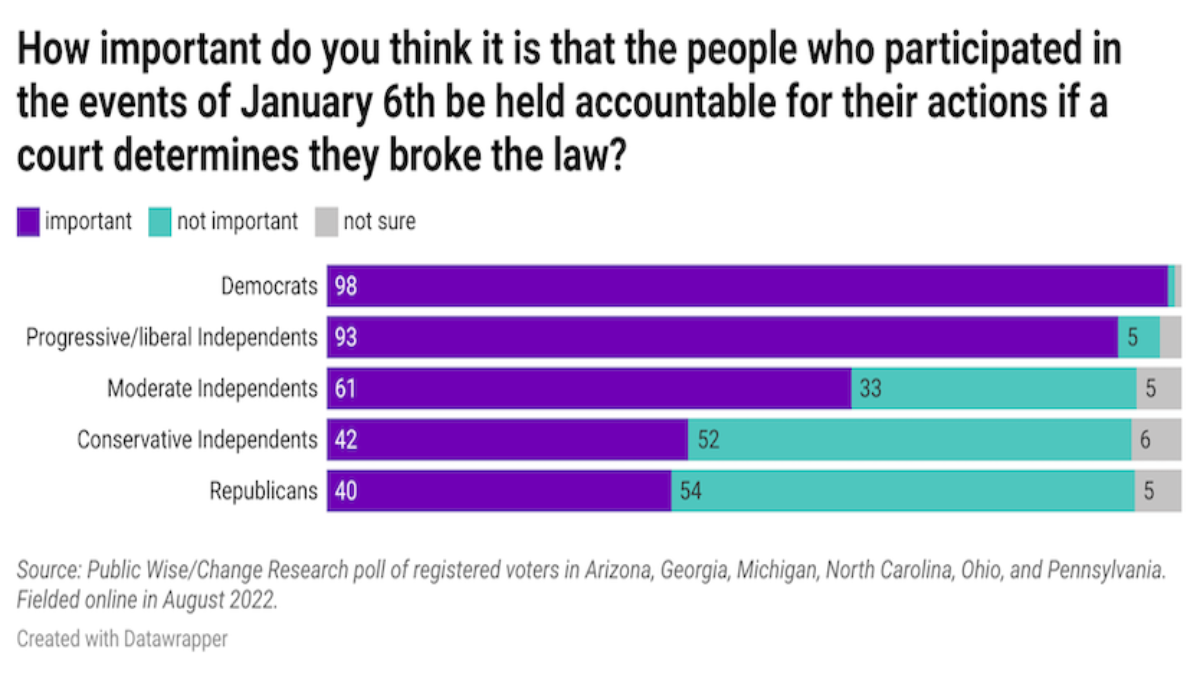
Accountability for those who participated in the events of January 6th, 2021 is important to a majority of voters in these six states. When we asked “How important do you think it is that the people who participated in the events of January 6th be held accountable for their actions if a court determines they broke the law?,” 68% of respondents said it was very or somewhat important.
As we’ve found in previous polling, the importance of accountability varies substantially by partisan identity and ideological lean. Virtually all Democrats (98%) and progressive/liberal Independents (93%) say accountability is important and a majority (61%) of moderate Independents agree. However, among conservative Independents and Republicans, the share that says accountability is important falls to 42 and 40%, respectively.
Older moderate Independents are more likely to say that accountability is important: 63% of 50-64 year olds and 74% of those 65+ said accountability was somewhat or very important, compared to 56% of 18-34 year olds and 54% of 35-49 year olds.
Conservative Independents display a different pattern with larger shares of younger people saying accountability is important. Among conservative Independents, 53% of 18-34 year olds and 44% of 35-49 year olds say accountability is important, compared to 39% of those 50-64 years old and 65+. For Republicans, age differences are not as stark and there is no age group for which a majority believes accountability is important. 45% of 18-34 year olds, 42% of 35-49 year olds, 37% of 50-64 year olds, and 40% of those 65+ believe accountability is important.
Although Republican support for accountability is below 50% in all of the states we sampled, there is some state variation in their support for accountability. On the lower end, only about a third (34%) of Republicans in Arizona say that accountability is important, followed by 38% in Pennsylvania, 39% in Ohio, 41% in Michigan, 43% in Georgia, and 45% in North Carolina.
Beyond general accountability, we also wanted to know more about views on accountability for elected officials that participated in the events of January 6th. We asked respondents if they think an elected official should remain in office if they…
- Voted against certifying the election
- Spoke at the rally on the mall before the events at the Capitol took place
- Paid for buses for people to come hear the rally and participate in a protest
- Coordinated with protestors in advance to help them understand the Capitol building and how to move within it quickly
Coordination remains the line in the sand for registered voters in these states. 67% of respondents said no, they should not remain in office if they coordinated with protestors to help them understand the Capitol building. For the remaining actions, less than half said no, they should not remain in office. 48% said they should not remain in office if they voted against certifying the election, 41% said no if they paid for buses for the rally, and 35% said no if they spoke at the rally before the events at the Capitol.
Partisan differences in beliefs about whether or not elected officials should remain in office if they engaged in any of these actions are stark. While 79% of Democrats say someone should not remain in office if they voted against certifying the election, only 21% of Republicans agree. 69% of Democrats say someone shouldn’t remain in office if they spoke at the rally beforehand, but only 7% of Republicans said the same. 70% of Democrats also believe someone shouldn’t remain in office if they paid for buses to attend the rally and protest. Less than a fifth (18%) of Republicans agree. Even opinions on coordination, the item with the smallest gap between Democrats and Republicans, displays stark partisan differences. 95% of Democrats say someone should not remain in office if they coordinated with protestors to help them understand the Capitol, but only 40% of Republicans agree. 26% of Republicans said yes they should remain in office and another 34% said they were not sure.
For some of these actions, the share of people saying that an elected official should not remain in office has dropped slightly since October 2021 and February 2022. As the table below shows, just over 40% said an elected official who spoke at the rally on the mall should not remain in office in October/February. It was closer to a third (35%) in August. Over half of people in October/February said an elected official should not remain in office if they paid for buses for people to attend the rally and protest. This was down to 41% in August. Even the share of those saying no, someone should not remain in office if they coordinated with protestors in advance, the action for which the partisan gap is the smallest, has declined: from 78/77% to 67% in August.
| October 2021 | February 2022 | August 2022 | |
| Voted against certifying the election | |||
| No, should not remain | 51 | 52 | 48 |
| Yes, should remain | 36 | 32 | 34 |
| Not sure | 13 | 16 | 18 |
| Spoke at the rally on the mall before the events at the Capitol took place | |||
| No, should not remain | 42 | 41 | 35 |
| Yes, should remain | 41 | 41 | 45 |
| Not sure | 17 | 18 | 20 |
| Paid for buses for people to come hear the rally and participate in a protest | |||
| No, should not remain | 56 | 54 | 41 |
| Yes, should remain | 30 | 30 | 39 |
| Not sure | 14 | 16 | 21 |
| Coordinated with protestors in advance to help them understand the Capitol building and how to move within it quickly | |||
| No, should not remain | 78 | 77 | 67 |
| Yes, should remain | 10 | 10 | 14 |
| Not sure | 12 | 13 | 19 |
| Note: Polls in October 2021 and February 2022 are nationally representative. The August 2022 poll is representative of the six states listed above. | |||
Declines2 in the share of people saying that an elected official who engaged in any of these actions should not remain in office appear to be driven by declines among both Democrats and Republicans. 82% of Democrats said no, they should not remain in office if they paid for buses in October, 77% said no in February, and it was down to 70% in August. About a third of Republicans agreed with Democrats in October and February, but by August it was down to 18%. In October, 77% of Democrats said an elected official should not remain in office if they spoke at the rally. This dropped to roughly 70% in February and August. Around 11% of Republicans said no, they should not remain in October and February, but it was down to 7% by August.
For coordination, the share of Democrats that say an elected official should not remain in office has not changed, however, the share of Republicans has. In the earlier surveys, 63% and 59% of Republicans said an elected official should not remain in office if they coordinated with protestors in advance. This was down to 40% in August.
Would you vote for someone if they participated in some capacity in the events of January 6th?
In addition to asking about accountability, we also included a series of statements based on evidence from the hearings and asked respondents if they would vote for a candidate if the statement applied to them. We included the following statements:
Would you vote for someone if they:
- Preemptively asked for a pardon to cover any and all actions related to the election and its aftermath
- Failed to act on advanced knowledge that rally attendees were armed
- Participated in plans to allow fake electors to cast votes during the electoral vote counting on January 6th
- Failed to act on advanced knowledge that members of extremist groups/militias planned to attend the rally
Overall, a majority of registered voters in these six battleground states said that they would not vote for candidates to which these statements applied. As the table below shows, nearly two-thirds said they wouldn’t vote for candidates that preemptively asked for a pardon, failed to act on knowledge about armed attendees, or failed to act on knowledge of extremist groups. More than 80% said they would not vote for someone that participated in plans to allow fake electors to cast votes during the formal counting of electoral votes.
| No, wouldn’t vote for |
Yes, would vote for |
Not sure | |
| Preemptive pardon |
65 |
14 |
21 |
| Failed to act on knowledge about armed attendees |
64 |
19 |
18 |
| Participated in fake elector plans |
83 |
7 |
10 |
| Failed to act on knowledge of extremist group attendance |
63 |
17 |
19 |
These majorities are largely driven by those on the left, including both Democrats and self-identified progressive and liberal Independents. Among Democrats, the share saying they would not vote for a candidate to which these statements apply was never lower than 92%. Among progressive/liberal Independents, it didn’t fall below 89%.
Moderates and those on the right are more split on this issue. Among moderate Independents, a strong majority (82%) said they would not vote for someone who participated in fake elector schemes. Just over half said they would not vote for someone who asked for a preemptive pardon (60%), failed to act on advanced knowledge that attendees were armed (56%), and failed to act on advanced knowledge that members of extremist groups were planning to attend the rally (56%).
Although they were smaller than those of Democrats and progressive/liberal Independents, majorities of moderate Independents indicated that they would not vote for a candidate to which each statement applied. That is not the case for those on the right. There was only one statement to which a majority of conservative Independents and Republicans responded no. 68% of conservative Independents and 72% of Republicans said they would not vote for someone who participated in fake elector schemes. Just over a third of Republicans said they would not vote for someone who preemptively asked for a pardon (35%), failed to act on knowledge about attendees being armed (37%), and failed to act on knowledge that extremist groups would be present (36%). Slightly more conservative Independents said they would not vote for someone who preemptively asked for a pardon (40%), but the distribution of their responses was largely the same as Republicans otherwise.
For moderate Independents, age is one dimension that splits views on willingness to vote for candidates, especially when it comes to a candidate that failed to act on knowledge that attendees were armed or a candidate that failed to act on knowledge that extremist groups would be present. Just under half (47%) of 18-34 year old moderate Independents said they would not vote for a candidate that failed to act on knowledge that attendees were armed. A quarter said they would vote for them and 28% said they weren’t sure. Among 50-64 year olds, the share that said no increased to 58% and among those 65+, it was 71%. About a fifth (22%) of 50-64 year olds said yes, compared to 12% of those 65+. We see a similar story for knowledge about extremist groups. 46% of 18-34 year olds said no they would not vote for a candidate that failed to act on knowledge that extremist groups would be present, compared to 59% of 50-64 year olds and 70% of those 65+. Age differences in willingness to vote for someone who asked for a preemptive pardon and someone who participated in fake elector plans are much smaller.
Although the share saying no they would not vote for a candidate to which any of these statements applies is lower, a broadly similar pattern emerges among conservative Independents.
January 6 Congressional Committee Hearings
63% of registered voters reported paying some or a lot of attention to the January 6th Congressional Committee hearings. Attention to the hearings is also stratified by party and ideology. Majorities of Democrats (87%), progressive/liberal Independents (79%), and moderate Independents (56%) report paying some or a lot of attention to the hearings. Smaller shares of conservative Independents (41%) and Republicans (43%) report the same.
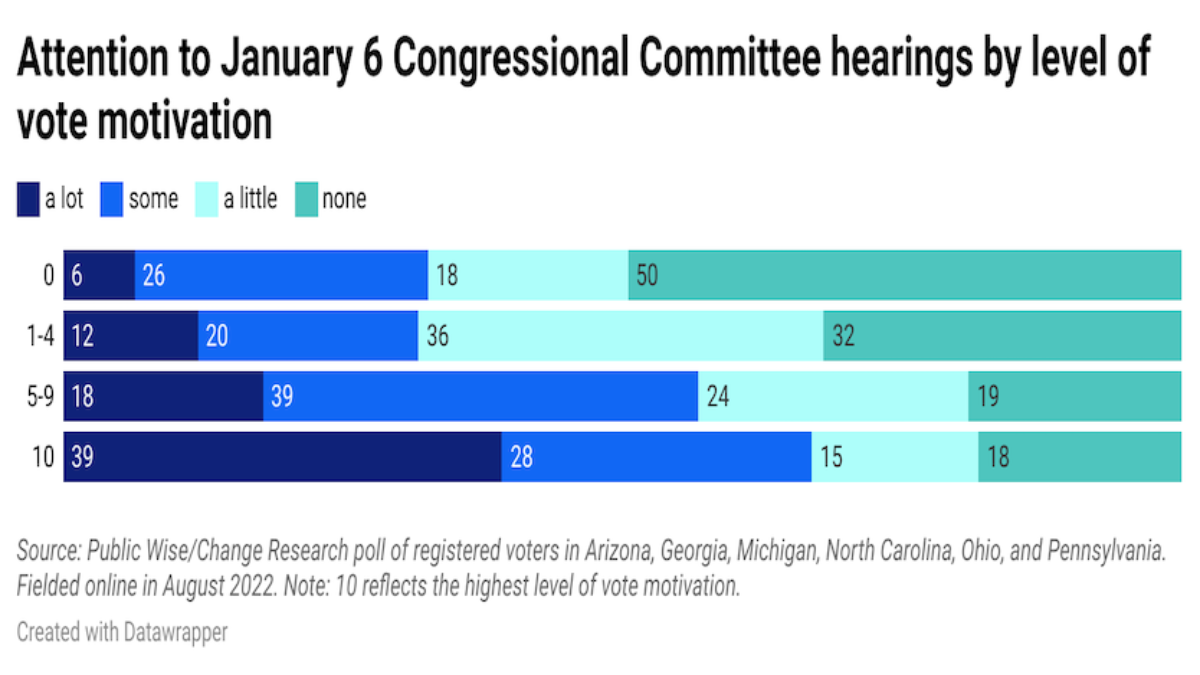
Of those who reported the highest level of motivation to vote (10/10), 39% said they have paid a lot of attention to the hearings and 28% said they have paid some attention to the hearings. Those saying they are paying a lot of attention to the hearings drops to 18% among those whose motivation to vote is between 5 and 9. However, 39% said they are paying some attention to the hearings. Among those who report their motivation being between 1 and 4, 12% said they are paying a lot of attention and 20% said they are paying some attention. Those who have no motivation to vote are the least likely to be paying attention to the hearings. 50% said they are paying no attention to the hearings. However, over a quarter (26%) do report paying some attention to the hearings.
Beyond asking about how much attention people are paying to the hearings, we also wanted to know about views on the credibility of the information being presented at the hearings. Just under half of registered voters in these six states said they find the information presented by the January 6th Committee to be somewhat (9%) or very credible (40%). Unsurprisingly, however, views on credibility are correlated with party. While 92% of Democrats find the information to be somewhat (10%) or very credible (82%), 82% of Republicans said it is not very (25%) or not at all credible (57%). Just under half (42%) of moderate Independents said the information is somewhat (12%) or very credible (31%).
We also asked respondents if they are more or less motivated to vote after the January 6th Congressional Committee hearings. Overall, roughly half are either somewhat more (10%) or much more (42%) motivated. Although very few people reported that they are less motivated (1% said somewhat less and 2% said much less) after the hearings, just under half (42%) said they are neither more nor less motivated to vote after the hearings.
Overall, equal shares of Democrats and Republicans said that they are much more motivated to vote after the hearings (48 and 47% respectively). Independents were less likely to say they were much more motivated, with 29% of progressive/liberal, 31% of moderate, and 38% of conservative Independents saying they are much more motivated to vote.
State by state, there are some differences between Democrats’ and Republicans’ motivation to vote after the hearings. In Georgia (54% vs 46%) and North Carolina (52% vs 46%), a larger share of Democrats say they are much more motivated to vote after the hearings. However in Michigan (41% vs 49%) and Pennsylvania (42% vs 51%), the share of Republicans who are much more motivated to vote after the hearings is larger. In Arizona (Dems: 49% and Reps: 47%) and Ohio (Dems: 47% and Reps: 42%), the difference between Democrats and Republicans is within the margin of error.
Motivation and plans to vote
Registered voters in these six states report high vote motivation for the upcoming midterm election. 72% of our sample reported being at the highest level of vote motivation, 10/10. Another 22% said they fall somewhere between a 5 and a 9. Only 6% said they are at a 4 or below.
The highest levels of vote motivation are among Democrats and Republicans. 78% of Democrats and 82% of Republicans report being at a 10. This falls to 56% for progressive/liberal Independents, 58% for moderate Independents, and 67% for conservative Independents. That said, only about 10% of Independents reported being at a 4 or below.
High motivation to vote is driven by older registered voters for all partisan and ideological groups. For Democrats, Republicans, and all Independents, regardless of ideological lean, those who are 65+ are most likely to report being 10/10 motivated to vote. 89% of 65+ Democrats, 88% of 65+ progressive/liberal Independents, 77% of 65+ moderate Independents, 86% of 65+ conservative Independents, and 90% of 65+ Republicans reported being 10/10 motivated to vote. This drops to 57%, 38%, 32%, 29%, and 64% among those who are 18-34 with the same party and/or ideological views.
Those who report being at a 10 on motivation to vote are more likely to say that accountability for those who participated in January 6 is important. Of those that reported being a 10/10, 66% said accountability is important, 31% said it’s not important, and 3% said they weren’t sure.
Motivation to vote is high among registered voters in these states, but motivation doesn’t always translate to higher turnout. For registered voters in these states, however, the data suggest that it might. In addition to asking how motivated they are to vote, we also asked if they plan to vote in the 2022 midterm elections. In total, 86% of registered voters in these battleground states said they are definitely planning to vote in the midterms. Another 7% said they will probably vote. Those who are definitely planning to vote include 90% of Democrats, 72% of progressive/liberal Independents, 77% of moderate Independents, 83% of conservative Independents, and 92% of Republicans.
Those who are highly motivated to vote are the most likely to say that they definitely plan to vote in the November 2022 election. Of those that said they are at a 10, 99% say they are definitely planning to vote. Among those who said they are somewhere between 5 and 9, 63% are definitely planning to vote.
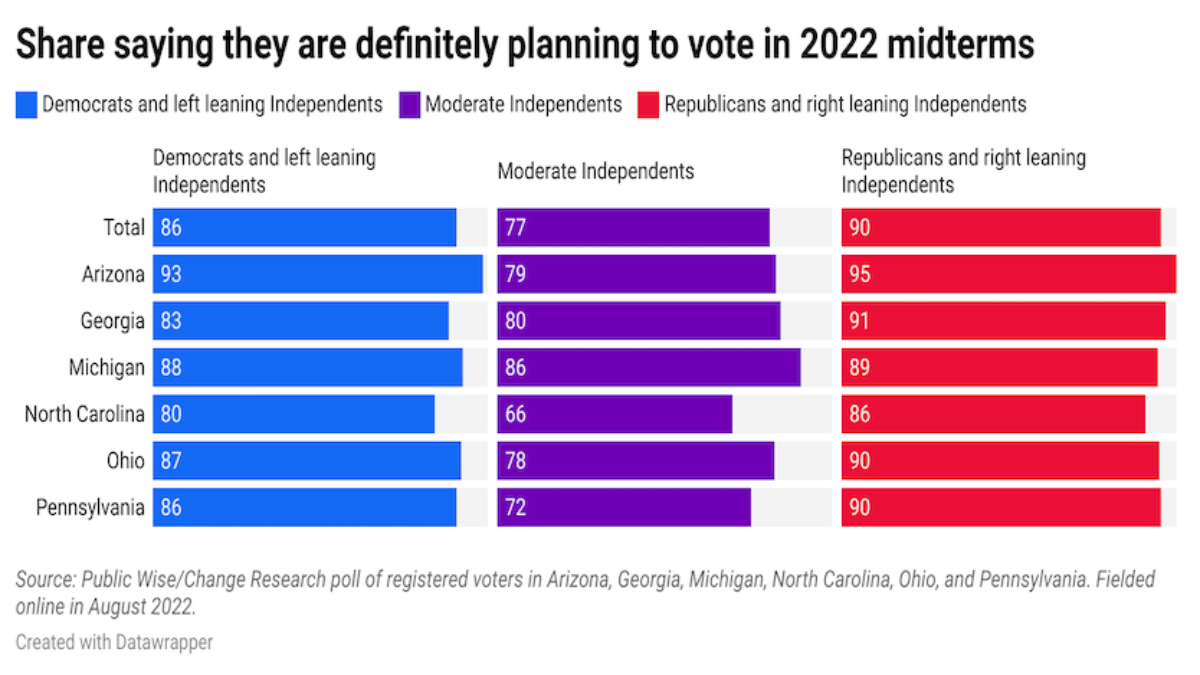
Although a majority of respondents of all party and ideological affiliations definitely plan to vote in the 2022 midterms, there is some variation across states. As the figure below shows, a majority of Democrats and progressive/liberal Independents definitely plan to vote in all six states. However, the share ranges from a low of 80% in North Carolina to 93% in Arizona.
Likewise, a majority of Republicans and conservative Independents definitely plan to vote in all six states, but it ranges from a low of 86% in North Carolina to 95% in Arizona.
A majority of moderate Independents in all six states definitely plan to vote, but the share that plans to vote is lower than Democrats/left leaning Independents and Republicans/right leaning Independents in all six states. And at the lowest, only 66% of moderate Independents in North Carolina definitely plan to vote, compared to 86% in Michigan.
FOOTNOTES:
1 We originally planned to survey a general population sample in each of the six states. However, most unregistered respondents dropped out of the survey at the start of the political questions, leaving us with a sample that is 96% registered voters in these six states.
2 While it’s possible that declines in the share of people saying no, an elected official should not remain in office if they engaged in these actions are actually due to differences between the registered voters in these states and registered voters nationwide, we suspect that is not the case as others have documented declines in support for accountability over time.