Where do voters in battleground states get their news?
In August 2022, Public Wise conducted a poll with Change Research on public opinion around the upcoming midterm elections, views on January 6, other political attitudes, and news media consumption. The poll focused on registered voters in six key battleground states: Arizona, Georgia, Michigan, North Carolina, Ohio, and Pennsylvania. This poll constituted the third in a series of polls around U.S. public opinion on January 6, the first two of which were conducted in October 2021 and February 2022. In this third poll, Public Wise was especially interested in looking into how views of the January 6 committee might influence upcoming behaviors and preferences in the midterm elections. More specifically, our poll asked about views on the recently broadcast January 6 committee hearings as well as specific modes of accountability for participants and elected officials who took part in different aspects of January 6th.
The general topline results of the poll focused on political attitudes and the upcoming midterm elections can be found here.
In the linked crosstab reports, we provide more detailed, state-specific toplines and crosstabs for the media-focused questions from the survey, as well as toplines for all six states pooled together and weighted by their relative populations of registered voters. Below, we detail some of the consistent findings across states regarding our findings about the correlations between partisan ideologies, media consumption patterns, and views on January 6, as well as how some states differed from the general patterns. We then breakdown patterns of newspaper, television, social media, and podcast consumption with data visualizations.*
Key General Takeaways
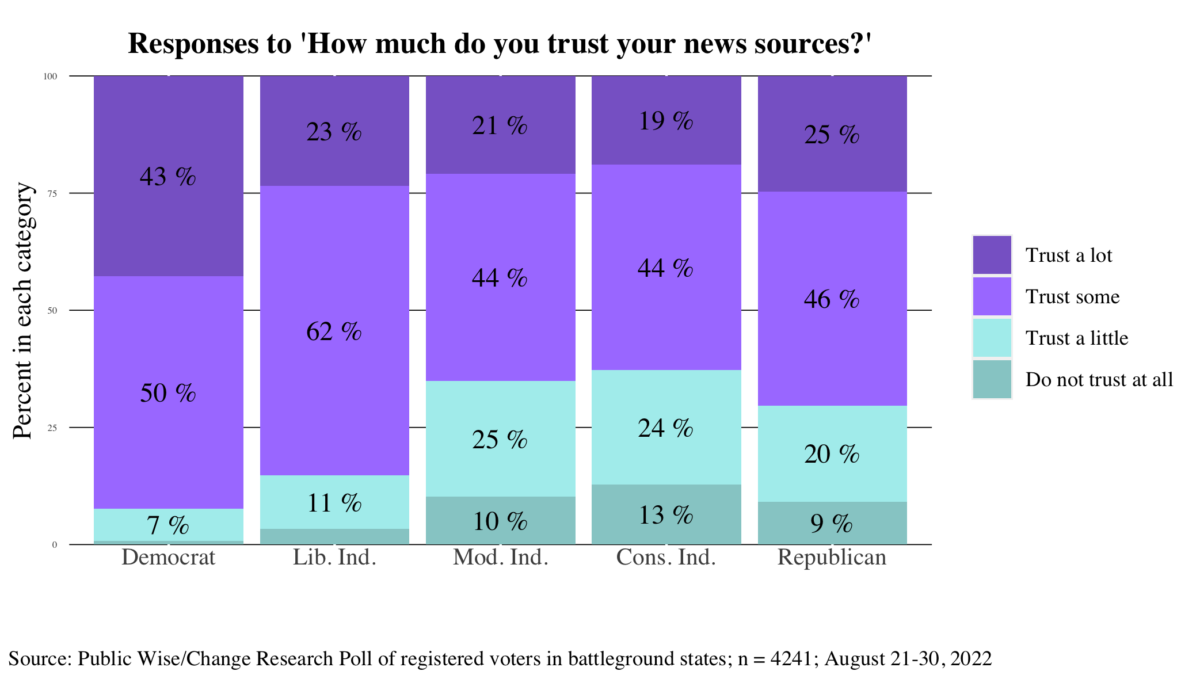
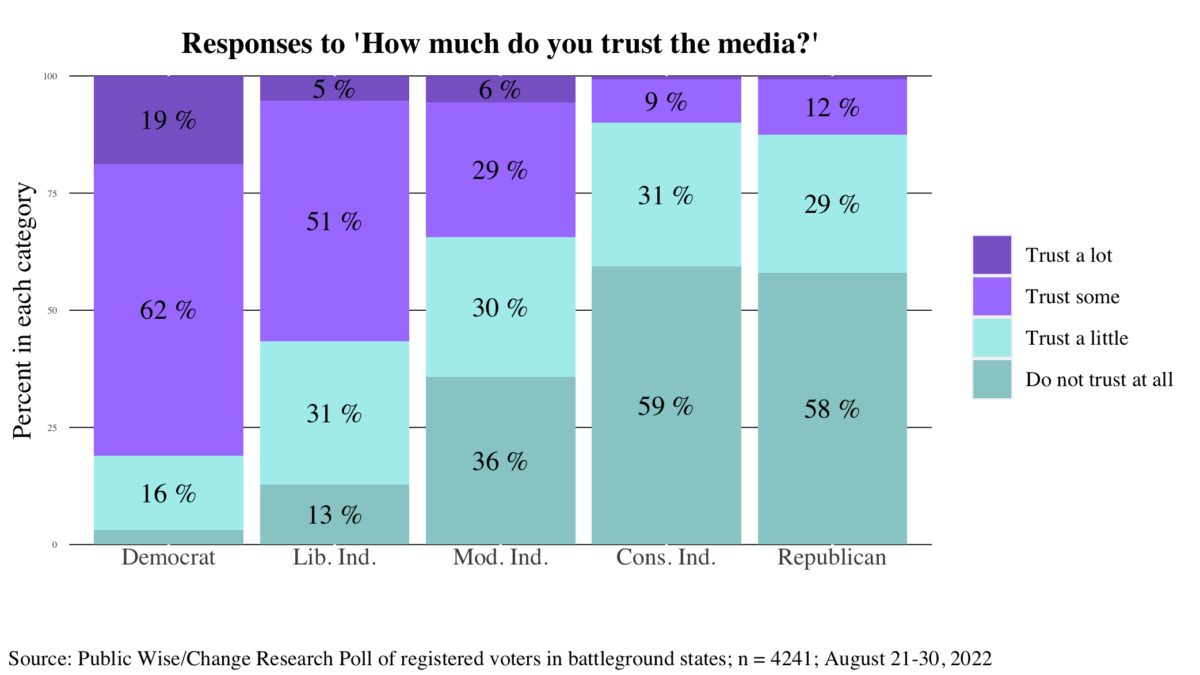
- Across all six states, moderate and conservative independents and Republicans are the most skeptical of their own news sources and of the media in general. However, they express more mistrust toward the media in general than they do the sources from which they get their news, when compared to Democrats. For example, 93% of Democrats trust (either a lot or some) their own news sources and 81% trust the media in general, whereas 71% of Republicans trust their own news sources but only 12% trust the media in general.
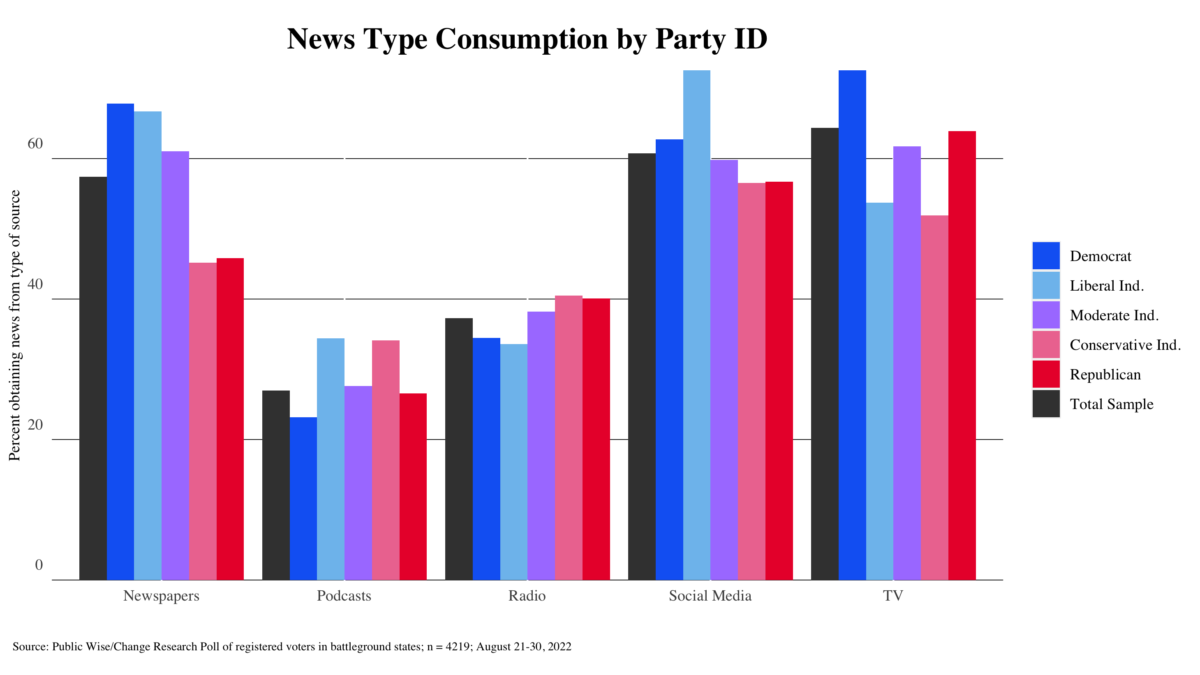
- TV is the most common source of news, followed by social media.
- TV and newspapers are much more popular sources of news for Democrats than Republicans, whereas podcasts and radio are more popular sources of news for Republicans than Democrats. Podcasts are more popular sources of news for independents than those who identified with one of the two major parties.
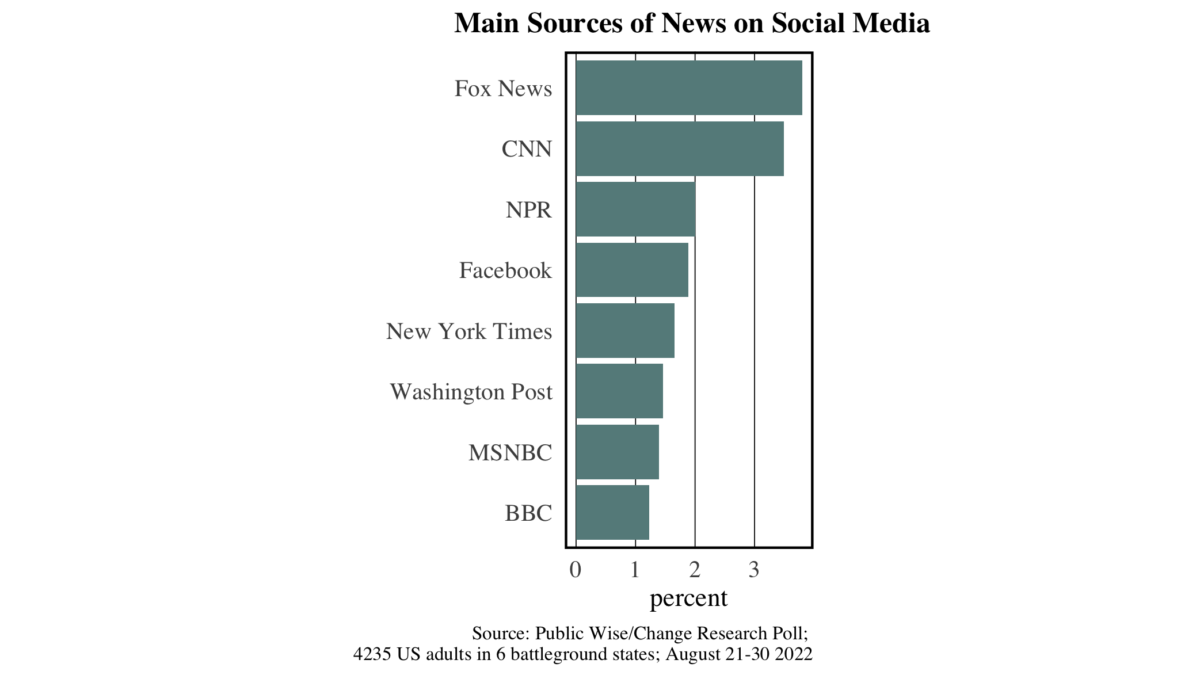
- When asked for open-ended responses about the top 3 channels, figures, or pages where people consume news on social media, the responses were overwhelmingly dominated by mainstream, institutional news networks. The top choices were Fox News, CNN, and NPR, all included in the list of at least 2% of our respondents in battleground states. This finding was consistent across age and gender demographics.
- TV news consumers are more likely to report paying “a lot of attention” to the January 6 committee, but newspaper consumers are more likely to find the January 6 committee to be “very credible” and report that they “strongly support” the committee.
- Compared to the overall sample of registered voters in battleground states, a larger proportion of respondents who reported consuming news by newspaper and television think legal accountability for January 6 participants is important. A smaller proportion of podcast news consumers think accountability is important as compared to the overall sample.
State-Specific Takeaways
- Democrats in Pennsylvania are less trusting of the media than Democrats elsewhere and consume less news in general, especially when it comes to getting news from social media and podcasts.
- There is more variability by state on how many people got their news from Fox News as compared to other news channels – in total, across battleground states 45% of registered voters reported getting news from Fox News, but this percentage was as high as 56% in Georgia and as low as 40% in Michigan.
- Some non-institutional sources of news showed up as especially popular in particular states in our open-ended responses. Heather Cox Richardson (a historian at Boston College) was reported as an important source of news on social media by at least 1% of respondents in both Michigan and in Pennsylvania. Beau of the Fifth Column (a left, working-class oriented Youtuber) was listed as an important news figure on social media by 1.5% of Michigander registered voters. The Lincoln Project (an anti-Trump Republican-led PAC) was listed as an important source of news on social media by 2% of our respondents in Ohio. 1% of respondents in North Carolina reported that they listen to right-wing pundit Matt Walsh’s podcast.
- Views around legal accountability for January 6 participants were especially politically polarized in Arizona, where 100% of Democrat respondents believed it to be important, while just 34% of Republican respondents did. Support for accountability was less polarized in North Carolina, where 45% of Republican respondents believed it to be important – 5 percentage points above the battleground state average for Republicans.
Trust in the Media
Across the six battleground states we surveyed, registered voters overall report low levels of trust in the news media in general. However, when asked how much they trust the news sources they regularly turn to, they have higher levels of trust. Trust in the media, both general and personal, are stratified by partisan and ideology in interesting ways. For example, 93% of Democrats trust their own news sources either some or a lot and 81% trust the media in general, whereas 71% of Republicans trust their own news sources but only 12% trust the media in general. Democrats are most likely to trust their own media sources while moderate and conservative Independents are least likely to trust even their own media sources with. In fact, 35% of moderate Independent, 37% of conservative Independent, and 29% of Republican registered voters in these six states report that they trust their own chosen news sources only a little or not at all.
Trust in the general news media is lower. 19% of registered voters who self-identify as Democrats trust the news media in general only a little or not at all compared to 7% who distrust their own chosen news sources. For registered voters who identify as liberal Independents the number who distrust (trust a little or do not trust at all) the news media in general jumps to 44%. Two-thirds of registered voters who self-identify as moderate Independents distrust the media and 90% and 87% of conservative Independents and Republicans, respectively, distrust the news media.
News Consumption
In the six battleground states we surveyed, the most common source of news among registered voters is television, followed by social media. Podcasts are the least common source of news. Registered voters who self-identify as Democrats are more likely to say they get their news from television and newspapers than those who identify as Republicans. Meanwhile, Republicans are more likely to get their news from podcasts and radio than Democrats. Podcasts are more popular among independents than they are among voters who identify with one of the two major parties.
Newspapers
Registered voters who self-identify as Democrats and liberal Independents in our six battleground states were most likely to say they get their news from the New York Times compared to other registered voters. Conservative Independents and Republicans who get their news from newspapers were more likely than other registered voters to say they go to Brietbart. The most likely answer from registered voters who report getting news from newspapers was some newspaper other than the ones we offered.
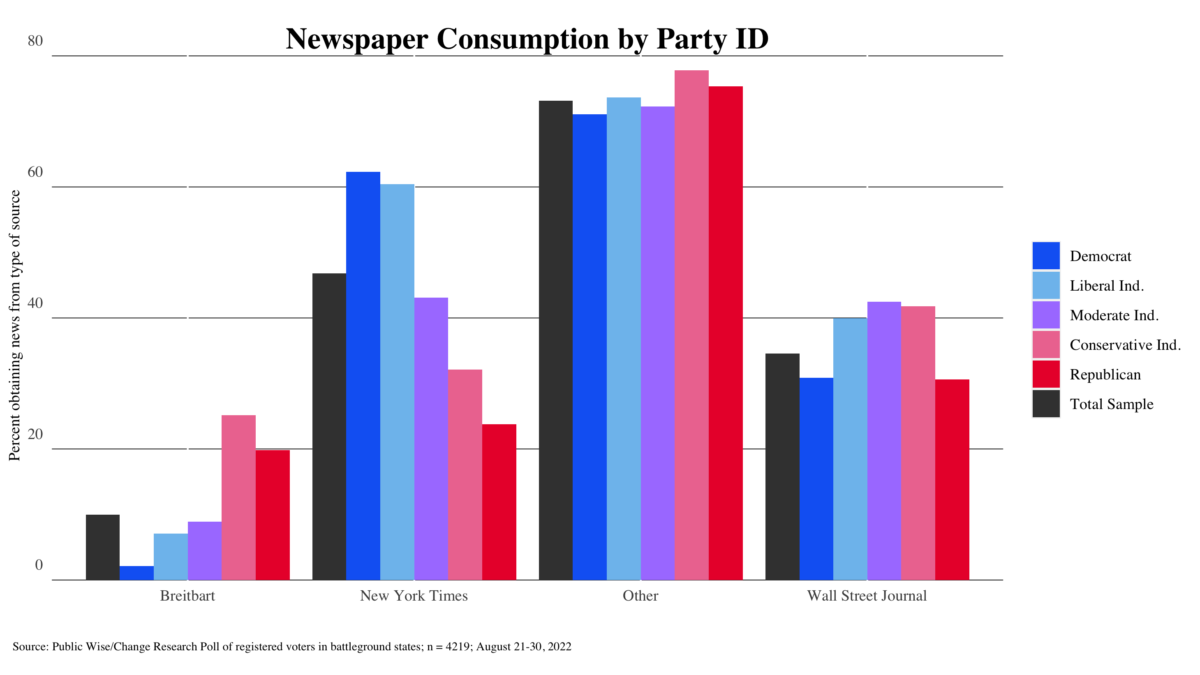
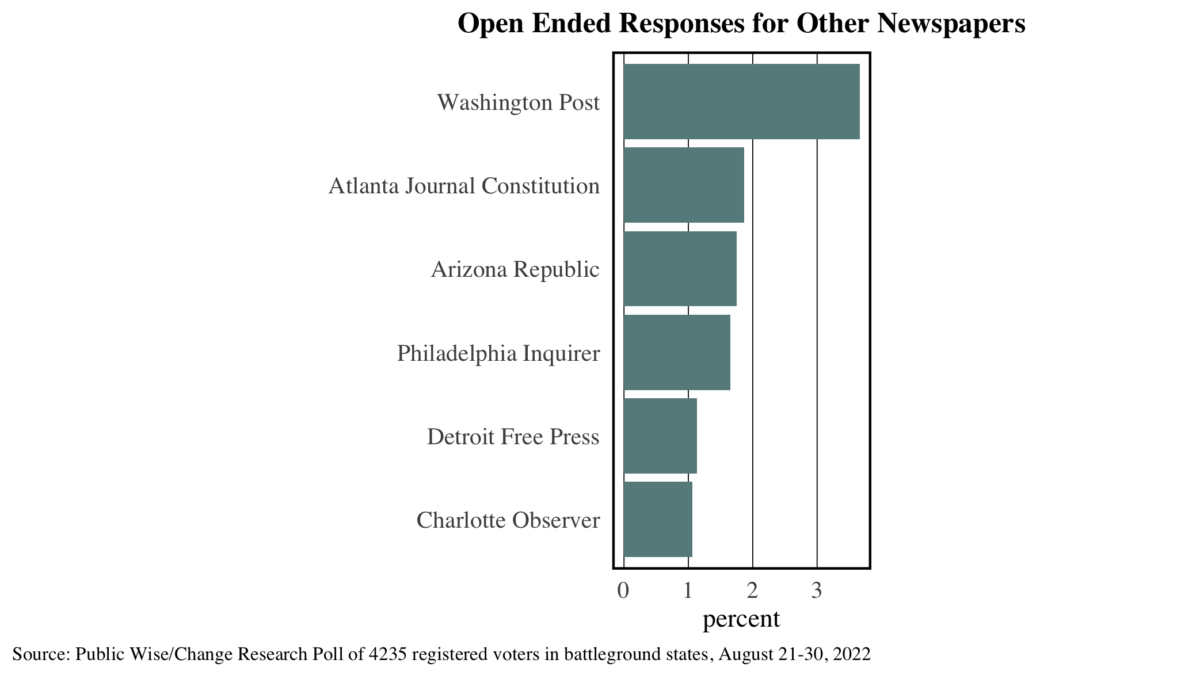
In the open-ended responses, registered voters who get their news from some other newspaper were most likely to report getting their news from the Washington Post. This was followed by several leading local newspapers in the states we surveyed, including the Atlanta Journal Constitution, the Arizona Republic, and the Philadelphia Inquirer.
Television
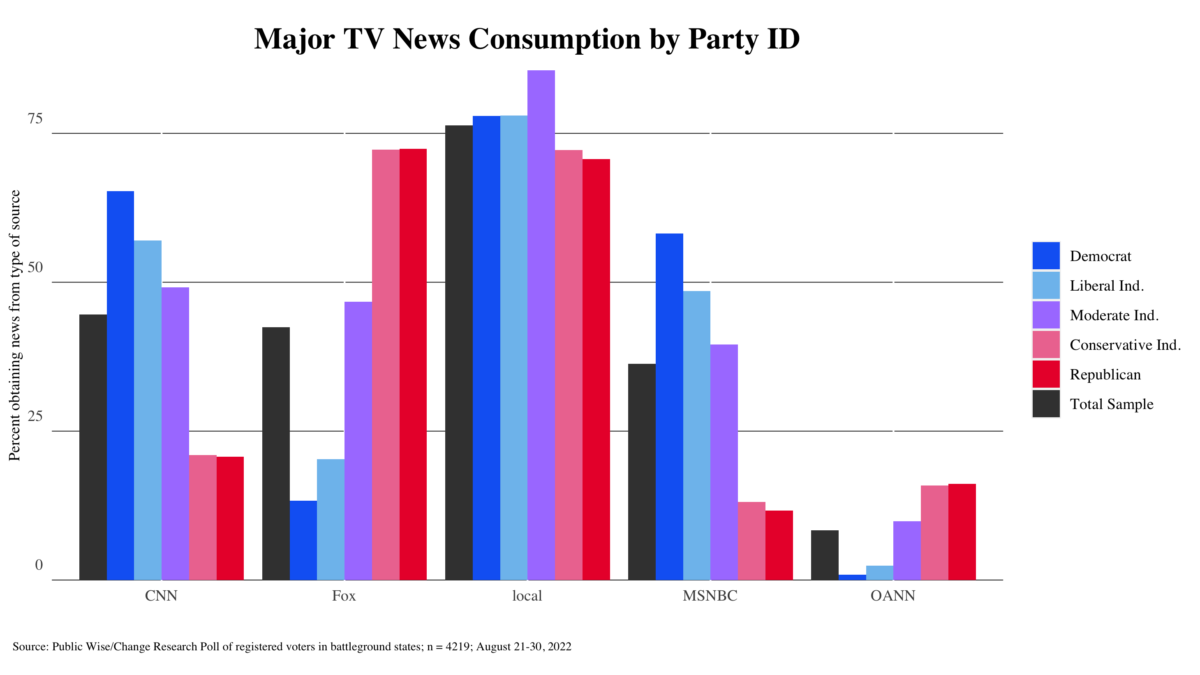
Among the television channels we provided as options, registered voters who self-identify as Democrats and liberal Independents in our six battleground states who report getting news from television were most likely to say they get their news from CNN, followed by MSNBC. Voters who identify as Republican and conservative Independents who get news from television were most likely to report getting news from Fox News. The most common response for television news sources across partisan ideologies was local news. Moderate Independents were the most likely to say they get their news from local news stations.
Social Media
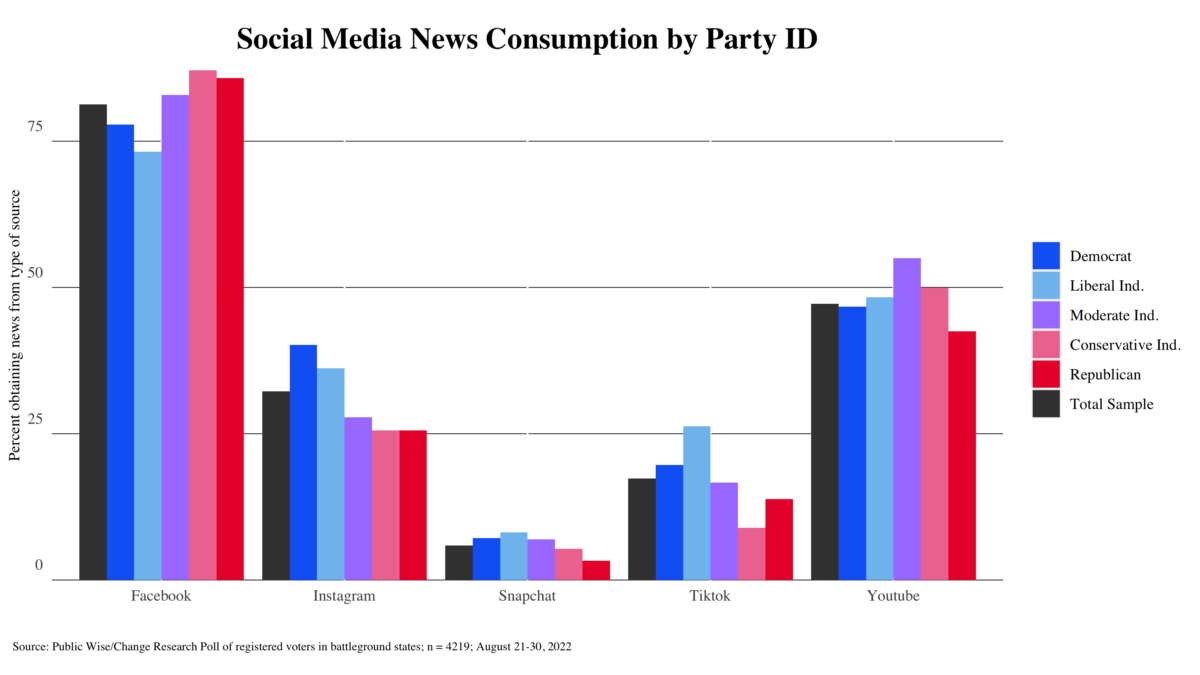
In our study on young potential voters, we found that YouTube was the most common source of news media nationally for 18-29 year olds. Among registered voters of all ages in our six battleground states, among those who say they get their news from social media, Facebook is the most commonly cited source across partisan and ideological lines. YouTube comes next but trails far behind.
We asked those who said they get their news from social media for the top three channels, figures, or pages where they get their news on social media regardless of platform. The responses to this question were overwhelmingly dominated by mainstream, institutional news networks. The top choices were Fox News, CNN, and NPR, all included in the list of at least 2% of our respondents in battleground states. This finding was consistent across age and gender demographics.
Podcasts
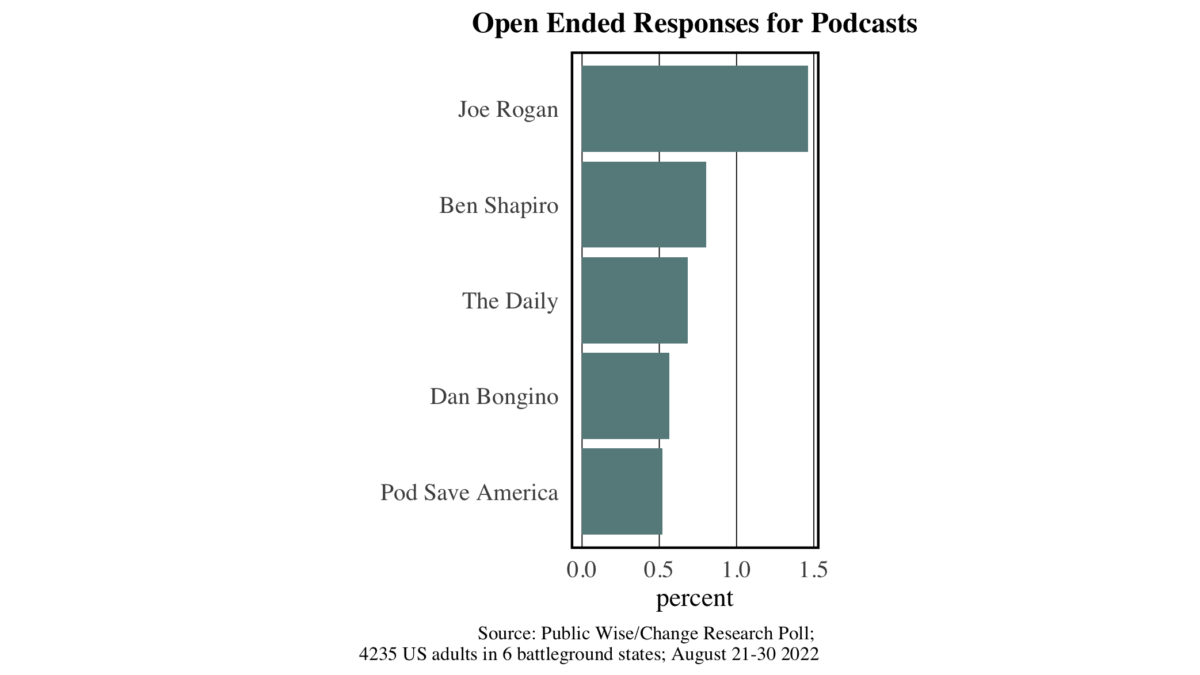
We asked those who said they get their news from podcasts to list what podcasts they listen to. The most reported podcast across registered voters in the six battleground states was the Joe Rogan podcast with almost 1.5% of all registered voters in these states saying they get news from Joe Rogan and just over 5% of those who say they get news from podcasts reporting Rogan as a source.
* Sample size shown at the bottom ofeach graph corresponds to the number of respondents who answered the question represented in the graph. The full sample size is 4,241. Not every respondent answered every question.